SNEAK PEEK
- Volatile LINK market tests bold whale’s fortunes.
- Bears dominate as the LINK price plunges, but short-term trading interest persists.
- Risky moves yield potential loss for the whales in the turbulent LINK market.
In a single deposit, a whale transferred a whopping 451,135 $LINK, worth approximately $2.26 million, into Binance. Shortly after, they withdrew 450,997 $LINK ($3.66M) in April and transferred it to Aave instead. This move was made when the price of $LINK was at $8.12 per token. Unfortunately for the whale, if they were to sell their holdings now, they would suffer a loss of around $1.4 million.
A whale deposited 451,135 $LINK ($2.26M) into #Binance 15 mins ago.
The whale withdrew 450,997 $LINK ($3.66M) from #Binance in April and deposited to #Aave.
At that time the price was $8.12, if he sells now, he will lose ~$1.4M.https://t.co/6AbSAVzdWB pic.twitter.com/ScwwCvd1UW
— Lookonchain (@lookonchain) June 10, 2023
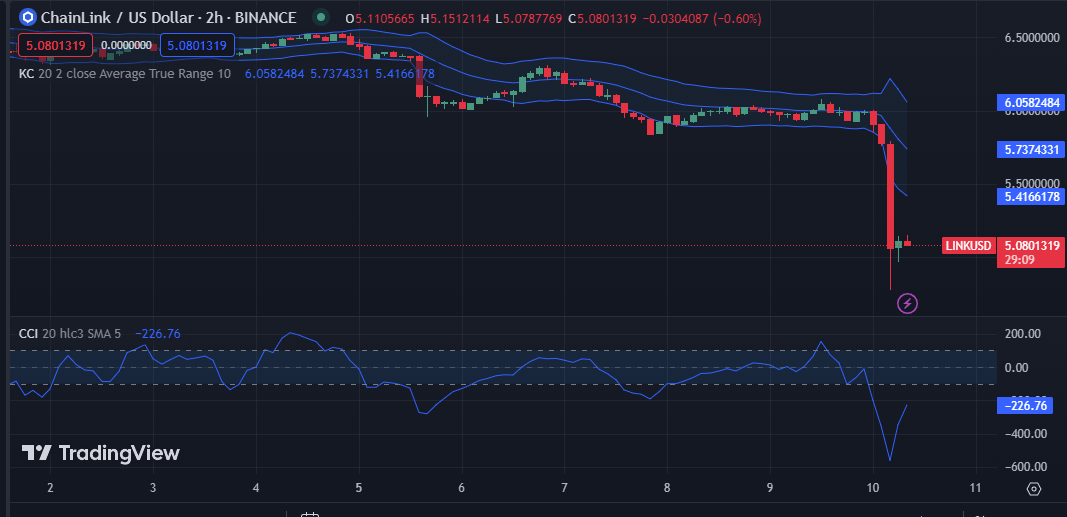
It’s unclear what the reasoning behind these transactions was, but it’s clear that this whale is fearless in making bold moves in the volatile world of crypto trading. However, despite bulls’ attempts to control the LINK market at an intraday high of $6.07, bears gained strength and drove the prices to an intraday low of $5.02. At the time of writing, persistent bearish pressure had caused the price to fall from 14.79% to $5.10.
Due to the recession, LINK’s market capitalization decreased by 14.79% to $2,635,648,510, while the 24-hour trading volume increased by 290.50% to $357,551,057. This move indicates that even though investors might be reluctant to hold onto LINK over the long term, short-term trading opportunities still have a sizable interest.
The Kelter Channels (KC) on the LINK market have upper and lower values of 6.0590324 and 5.4174352, respectively. The market is clearly in a downtrend based on this movement. If the price movement penetrates the bottom line, it might signal continued downward momentum and offer chances for profit-taking or short-selling.
On the 2-hour price chart for the LINK market, the Commodity Channel Index (CCI) is negative and has a value of -226.76. This movement indicates significant selling pressure on the market and that a price reversal will probably happen soon. Although the price of LINK is currently lower, a price increase could happen soon.

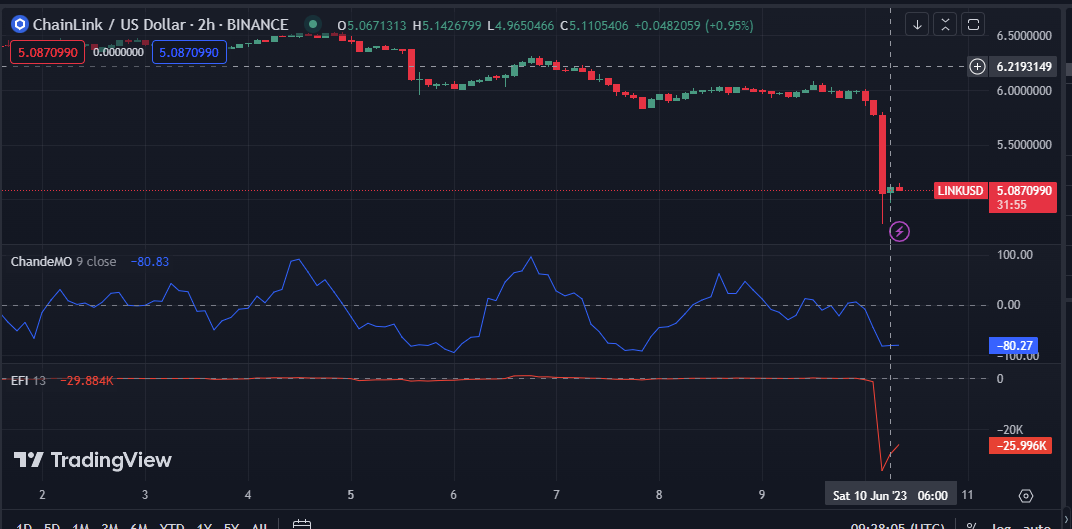
The Chande Momentum Oscillator (ChandeMO) on LINK’s 2-hour price chart is in the negative territory with a reading of -80.27. This move shows sellers have a firm hold on the LINK market, which is currently in a bearish trend. When considering taking long positions, traders should use caution because there is a high likelihood that prices will fall.
On the 2-hour price chart for the LINK market, the Elder Force Index (EFI) is negative with a value of -25.996k, indicating increased selling pressure in the market, which might portend a continued bearish trend. Although the price of LINK has decreased, a sizable price increase might be forthcoming.

In conclusion, the bold whale’s risky moves in the volatile LINK market resulted in a potential loss, but short-term trading interest remains strong amidst downward momentum.
Disclaimer: Cryptocurrency price is highly speculative and volatile and should not be considered financial advice. Past and current performance is not indicative of future results. Always research and consult with a financial advisor before making investment decisions
- SEO Powered Content & PR Distribution. Get Amplified Today.
- EVM Finance. Unified Interface for Decentralized Finance. Access Here.
- Quantum Media Group. IR/PR Amplified. Access Here.
- PlatoAiStream. Web3 Data Intelligence. Knowledge Amplified. Access Here.
- Source: https://investorbites.com/chain-link-price-analysis-10-06/
- :has
- :is
- :not
- $3
- 10
- 12
- 14
- 15%
- 22
- 26%
- 27
- a
- aave
- advice
- advisor
- After
- ago
- Although
- always
- amidst
- an
- analysis
- and
- approximately
- April
- around
- AS
- At
- Attempts
- based
- BE
- bearish
- Bears
- because
- before
- behind
- binance
- bold
- Bottom
- but
- by
- capitalization
- caused
- caution
- Center
- chain
- chances
- Channel
- channels
- Chart
- clear
- clearly
- commodity
- conclusion
- considered
- considering
- continued
- control
- could
- crypto
- crypto trading
- Current
- Currently
- deposit
- deposited
- Despite
- Dominate
- downtrend
- downward
- elder
- Even
- external
- Fall
- financial
- financial advice
- Firm
- For
- Force
- forthcoming
- fortunes
- from
- future
- gained
- Gamble
- had
- happen
- Have
- he
- High
- highly
- hold
- Holdings
- However
- HTTPS
- if
- in
- Increase
- increased
- index
- indicates
- instead
- interest
- internal
- into
- investment
- investor
- Investors
- IT
- Line
- LINK
- link price
- LINK price analysis
- LINK/USD
- Long
- lose
- loss
- Low
- lower
- made
- Making
- Market
- Market Capitalization
- Market News
- might
- million
- Momentum
- move
- movement
- moves
- negative
- negative territory
- news
- now
- of
- offer
- on
- opportunities
- or
- over
- past
- performance
- persists
- plato
- Plato Data Intelligence
- PlatoData
- plunges
- positions
- potential
- pressure
- price
- Price Analysis
- price chart
- Price Increase
- Prices
- probably
- Reading
- recession
- remains
- research
- respectively
- Results
- Reversal
- Risky
- s
- sell
- Sellers
- Selling
- Sells
- Short-selling
- short-term
- Shortly
- should
- Shows
- Signal
- significant
- single
- sizable
- soon
- Source
- speculative
- Still
- strength
- strong
- taking
- term
- territory
- tests
- that
- The
- their
- There.
- These
- they
- this
- though?
- time
- to
- token
- Traders
- Trading
- trading volume
- TradingView
- Transactions
- transferred
- Trend
- turbulent
- unfortunately
- use
- value
- Values
- volatile
- volume
- was
- were
- Whale
- whales
- What
- when
- which
- while
- will
- with
- world
- worth
- would
- writing
- Yield
- zephyrnet


