Join Our Telegram channel to stay up to date on breaking news coverage

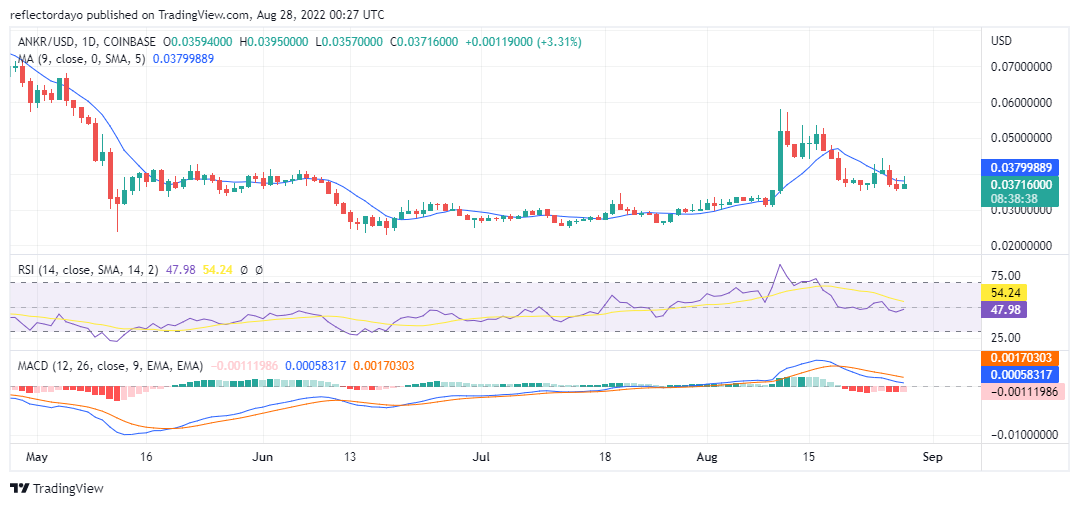
Demand and Supply in ANKR/USD market are proportionately responsive to each other. Looking at the chart, the buying pressure increases on the 11th of August. In the following days, sellers began to regain strength to drive down the market. This bearish momentum took 15 days to bring the price near the support level of 0.03543240USD. it is from this point (as we can see from today’s market behaviour) bulls began to make effort to regain their ground in the market.
Ankr Price Statistic:
- ANKR/USD price now: $0.03753
- ANKR/USD market cap: $ 362,295,363
- ANKR/USD circulating supply: 9.66 Billion
- ANKR/USD total supply: 10,000,000,000
- ANKR/USD coin market ranking: #91
Key Levels
- Resistance: $0.04014956, $0.0442238, $0.0500000
- Support: $0.03543240, $0.03157290, $0.02921431
Your capital is at risk
Ankr Price Analysis: The Indicators Point of View
The Relative Strength Index line recovers from the overbought zone to settle at around the midpoint of the indicator. The force from the buyers and sellers is like making the price of Ankr oscillate at an equilibrium point. However, this may not be for long. According to pieces of information from the MACD, the histogram that represents today’s market activities shows that buying pressure may be recovering, although the strong selling pressure of recent days has kept the two MACD lines away from each other.


Ankr Price Analysis: ANKR/USD 4-Hour Chart Outlook
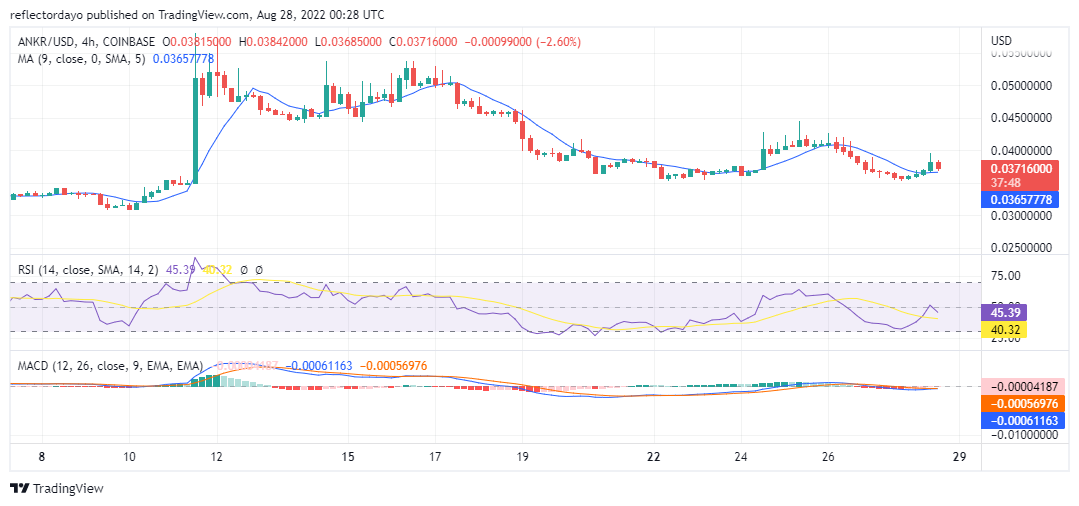
Earlier, buyers show signs of aggression to take the market, as they even make the price actions to recover above the 9-day moving average. Also in the RSI, the indicator line tested the upper zone at 51%, then it falls back to 45%. As it appears now, sellers are showing signs of aggression. This market behaviour may lead to another consolidation period making the price swing around $0.0372. more Buyers are needed’ to spice up the ANKR/USD market’.
Related
Tamadoge – Play to Earn Meme Coin
- Earn TAMA in Battles With Doge Pets
- Capped Supply of 2 Bn, Token Burn
- NFT-Based Metaverse Game
- Presale Live Now – tamadoge.io
Join Our Telegram channel to stay up to date on breaking news coverage
- Altcoins
- analysis
- Ankr
- ANKR/USD
- Bitcoin
- blockchain
- blockchain compliance
- blockchain conference
- coinbase
- coingenius
- Consensus
- consolidation
- crypto conference
- crypto mining
- cryptocurrency
- decentralized
- DeFi
- Digital Assets
- ethereum
- Guides
- InsideBitcoins
- machine learning
- non fungible token
- plato
- plato ai
- Plato Data Intelligence
- Platoblockchain
- PlatoData
- platogaming
- Polygon
- proof of stake
- Trading
- W3
- zephyrnet


