Balancer and The Graph prices are galloping higher with favorable tailwinds. GRT/USDT may rise to $1.30 while BAL/USDT bulls eye $44.
Balancer (BAL)
The swapping platform is unique since users can create three different pool types. Also, multiple tokens can be added in a pool, not necessarily ETH.
Past Performance of BAL
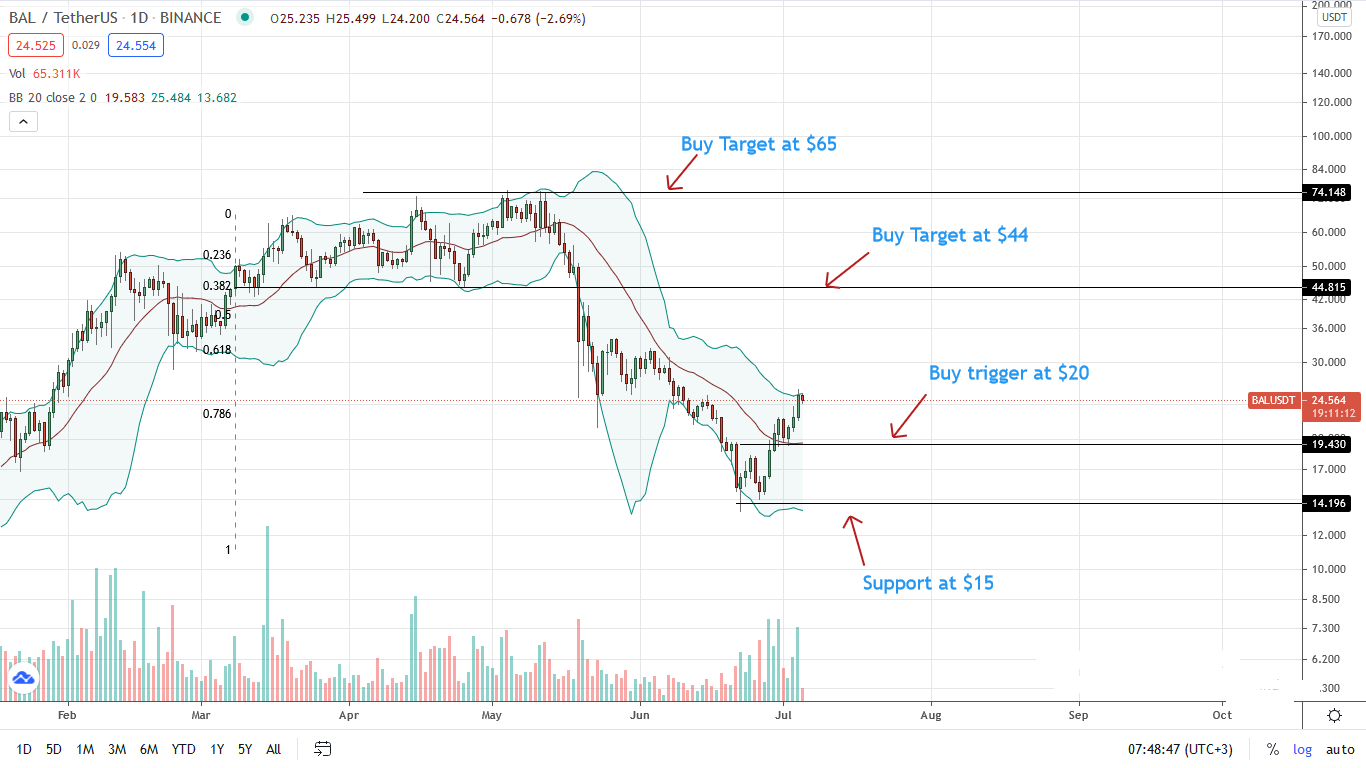
From the daily chart, BAL is bouncing back much to the relief of traders after deep losses.
BAL prices are up eight percent—adding versus ETH, BTC, and the USD at the time of writing.
Technical candlestick arrangement pattern favors bulls as prices encouragingly expand.
Day-Ahead and What to Expect
BAL/USDT prices found support from $15, $4 away from H1 2021 lows of around $11.
Notably, the reversal from 2021 pits is with decent trading volumes reading from the climactic participation pushing BAL higher.
Presently, BAL is within a bullish breakout pattern with $20 as the primary support.
BAL/USDT Technical Analysis
BAL prices are trading a bullish breakout pattern above June 21 highs, with rising trading volumes indicating demand.
At present, BAL bars are beginning to band along the upper BB as momentum builds up.
Ideally, every low may be a buying opportunity for bulls targeting $44.
Unexpected price contraction below $18 halts the uptrend.
The Graph (GRT)
Using the platform, users can query public chains like Ethereum and IPFS. Thus far, there are over 3k sub-graphs. GRT is native to the protocol.
Past Performance of GRT
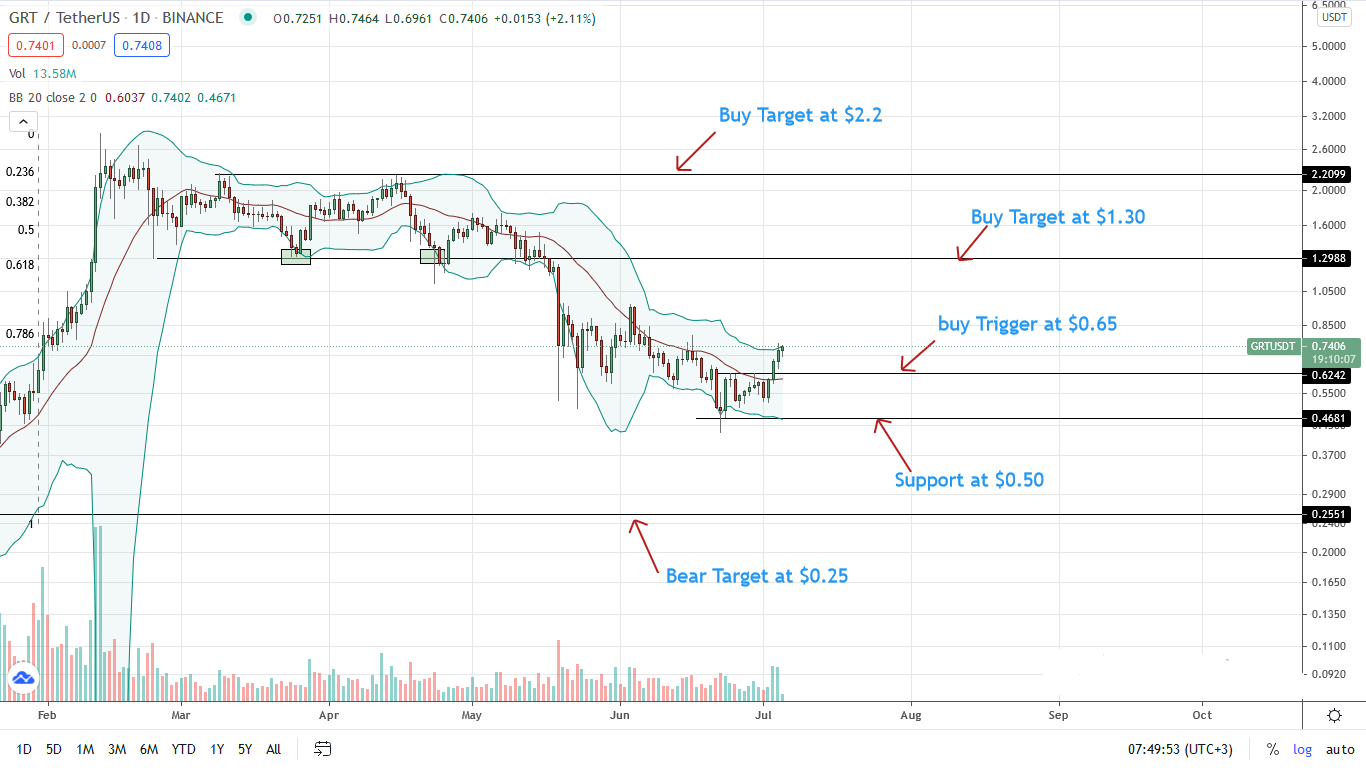
For the first time in over ten weeks, GRT prices are above the middle-BB. Accompanying the expansion is a rise in trading volumes, a net positive for traders.
Technical candlestick arrangement favor bulls as per price action in the daily chart.
At the time of writing, GRT is up roughly 10 percent versus the USD.
Day-Ahead and what to Expect
GRT/USDT prices are bottoming up after the decimation of May and June—a time in which GRT prices tanked over 75 percent from peaks.
June 21 losses have already been reversed, and the subsequent confirmation lifts GRT above the middle BB, signaling strength.
GRT/USDT Technical Analysis
GRT prices are trading in a bullish breakout pattern above June 21 highs and the middle BB from the daily chart.
Accordingly, every low may be a loading opportunity for aggressive GRT traders aiming for $1.30.
A dump down below $0.65 may see GRT drop to $0.50 as bears take charge.
- "
- Action
- active
- Aiming
- analysis
- around
- bars
- Bears
- Bitcoin
- border
- breakout
- BTC
- Bullish
- Bulls
- Buying
- charge
- CloudFlare
- Demand
- Drop
- ETH
- ethereum
- Expand
- expansion
- eye
- Figure
- First
- first time
- HTTPS
- IPFS
- IT
- July
- Momentum
- net
- Opportunity
- Option
- Pattern
- performance
- platform
- pool
- Posts
- present
- price
- public
- purchase
- Reading
- relief
- support
- Supports
- Technical
- Technical Analysis
- time
- Tokens
- Traders
- Trading
- USD
- users
- Versus
- within
- writing


