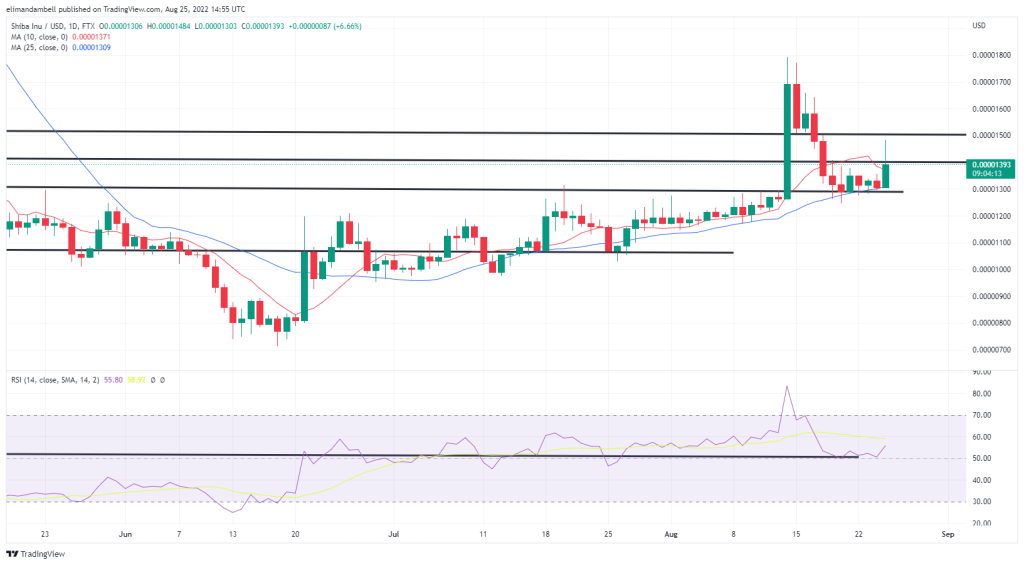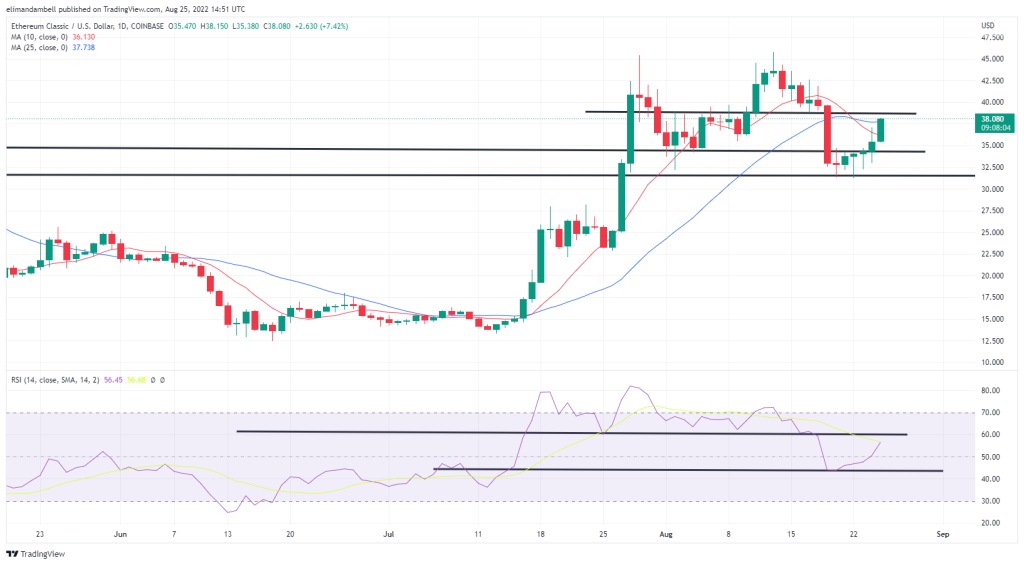
Shiba inu was trading over 10% higher during Thursday’s session, as the token rallied to a one-week high. Following a week’s worth of consolidation, the meme coin bounced from a key support level, moving closer to a resistance point of $0.00001500. Ethereum classic was also in the green, climbing for a fifth consecutive session.
Shiba Inu (SHIB)
Shiba inu (SHIB) surged by as much as 10% on Thursday, pushing the meme coin to its highest point in over a week.
Following almost seven days of consolidating near its floor of $0.00001290, SHIB/USD rose to a high of $0.00001475 earlier in today’s session.
The move saw the token break out of a recent resistance point at $0.00001400, on its way to its highest point since August 18.

Looking at the chart, it appeared that bulls were targeting a higher ceiling at $0.00001510, however there was significant pushback from bears.
As of writing, SHIB is now trading at $0.00001419, as earlier gains have eased, with the 10-day (red) moving average continuing to move closer to its 25-day (blue) counterpart.
Although the token is still trading above the $0.00001400 resistance level, should bearish momentum persist, we will likely see a retreat below this point.
Ethereum Classic (ETC)
Ethereum classic (ETC) was also higher in today’s session, as it moved back towards the $40.00 region.
ETC was also likely higher on Thursday as a result of today’s news surrounding the The Merge event, leading the token to extend recent gains.
Similar to SHIB, today’s move sees ETC/USD surge by 10%, hitting an intraday high of $37.46 in the process.

The token has now climbed higher for five straight days, which began when prices rallied from its support point of $31.
During this run, the 14-day relative strength index rose from its own floor at 43.50, and as of writing is tracking at 56.37.
The index looks to be heading for a higher ceiling at 60.00, and should it hit this point, ETC will likely be trading at or above $40.00.
Register your email here to get weekly price analysis updates sent to your inbox:
Will we see more gains in ethereum classic ahead of The Merge? Let us know your thoughts in the comments.
Image Credits: Shutterstock, Pixabay, Wiki Commons
Disclaimer: This article is for informational purposes only. It is not a direct offer or solicitation of an offer to buy or sell, or a recommendation or endorsement of any products, services, or companies. Bitcoin.com does not provide investment, tax, legal, or accounting advice. Neither the company nor the author is responsible, directly or indirectly, for any damage or loss caused or alleged to be caused by or in connection with the use of or reliance on any content, goods or services mentioned in this article.
Read disclaimer
- analysis
- Bitcoin
- Bitcoin News
- blockchain
- blockchain compliance
- blockchain conference
- coinbase
- coingenius
- Consensus
- crypto conference
- crypto mining
- cryptocurrency
- decentralized
- DeFi
- Digital Assets
- etc
- ethereum
- Ethereum Classic
- machine learning
- Market Updates
- non fungible token
- plato
- plato ai
- Plato Data Intelligence
- PlatoData
- platogaming
- Polygon
- proof of stake
- SHIB
- Shiba Inu
- W3
- zephyrnet


