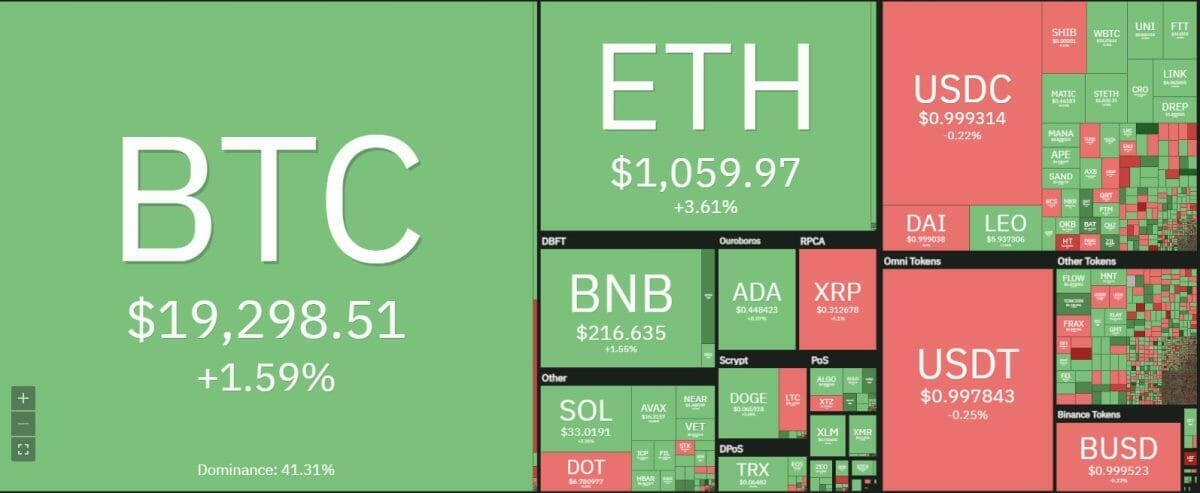
Bitcoin price analysis just got more confusing as June 2022 comes to a close. The entire crypto market is looking at the damage caused to the major coins in the past month. The price of Bitcoin has seen extreme movement ranging from $32,000 to a low of $17,500. The traders, both bears and bulls, found many opportunities to trade but the long-term investor has lost most worth. In fact, the entire crypto market has seen new lows which have not gone down well for the crypto sentiment.

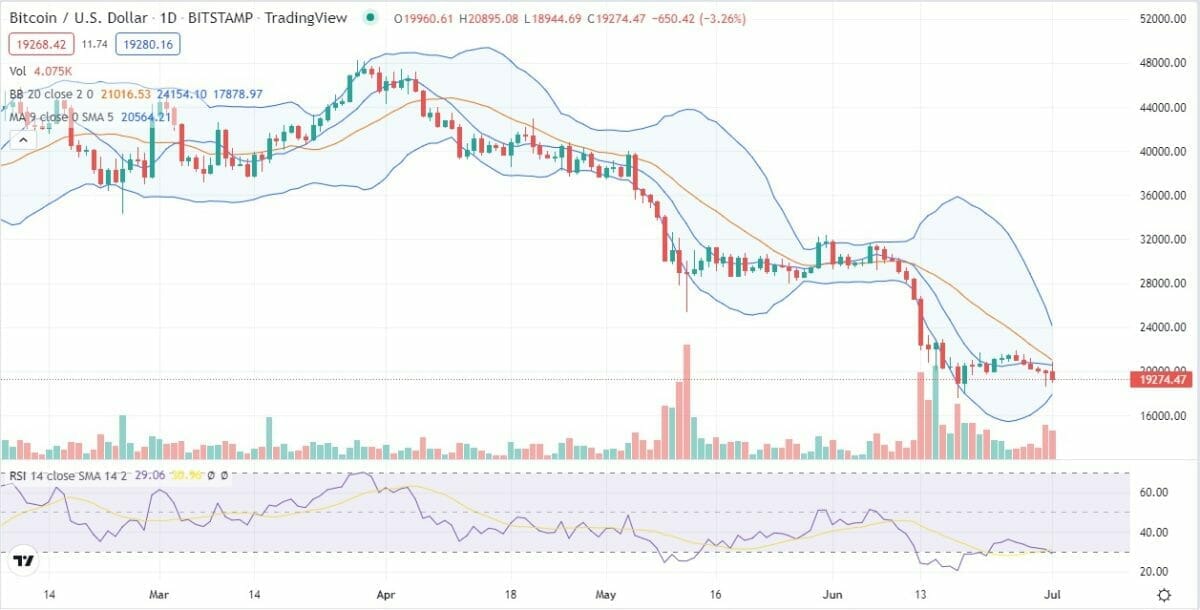
The Bitcoin price analysis suggests that the price of BTC/USD is going sideways. The past 24 hours has seen the price move between the narrow Bollinger Bands. The slight upward movement towards $20,900 has been contained by the bears as selling resumed and bought the price down at $19,000. The bulls are also selling on rallies and booking profits since the price can turn extreme bearish on the daily charts.
Bitcoin price movement in the last 24 hours: Bearish sentiment dominates the charts

The huge red-coloured month end candle for June further consolidates the negative bias in the crypto market. As per Bitcoin price analysis, the BTC/USD pair is moving lower and consistently posting red candles on the larger timeframe charts. Despite being in the negative territory for far too long, the bears are unrelenting to let the price rise. Minor upward movements are not helping the matter either.
The daily trajectory remains bearish as the descending price channel is also moving lower. The HODLers, miners and investors are all selling. The recent inflows into the exchanges created hopes of a revival but the price action does not support any shar upward movement. The 9-day moving average is also moving closer to the lower Bollinger Band which means that the price is gradually moving lower as per Bitcoin price analysis.
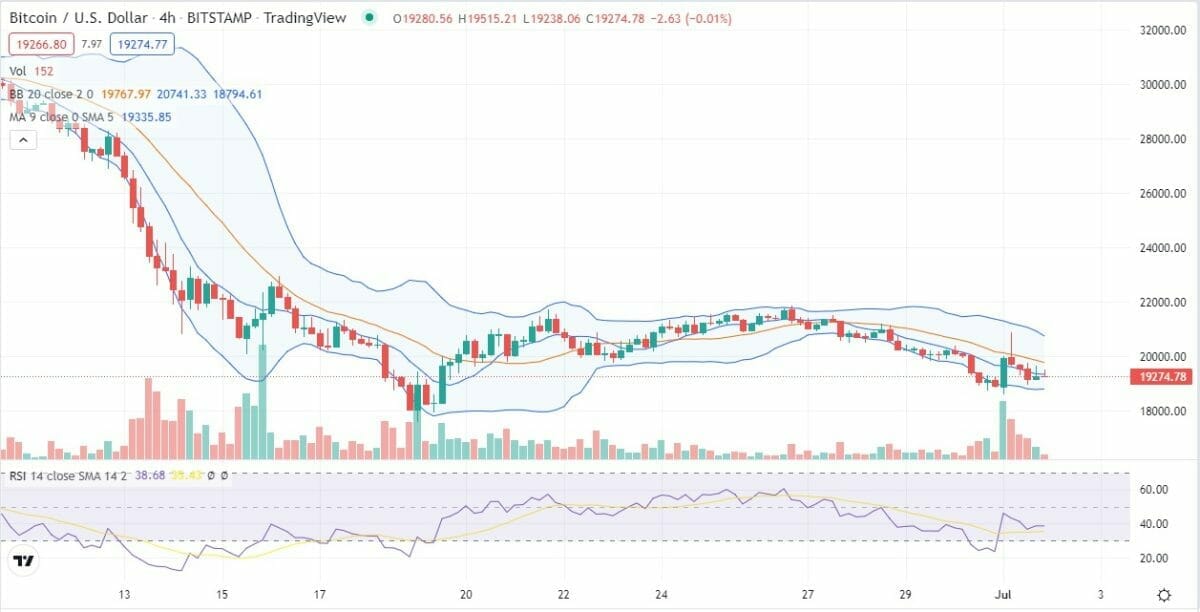
BTC/USD 4-hour price chart: Traders are sitting on the sidelines

Today’s slight upward movement towards the $20,900 level was quickly sold into by the bulls. This reflects the underlying negative sentiment in the market. The small rallies are being used as an excuse to prop up the price and create an exit strategy for the bulls. The technical indicators also post a grim picture.
The RSI is has risen from lower 20’s to its current level at 30. The price action has been choppy to say the least with a gradual decline towards $19,000. The bulls will have to defend the $19,000 support zone otherwise the price can quickly slip towards $17,500 level.
Bitcoin price analysis conclusion: Slow grind towards lower support zone at $17,500
Bitcoin has lost close to 9 percent of its value in the past week alone. The volatility has seen the price break many support levels between $23,500 to $19,000. The slow grinding action means that the price is moving at a slow pace towards lower support zones near $17,500 region. The minor leg up to the $20,900 zone helped the pair close above the 2017 all-time high.
Disclaimer. The information provided is not trading advice. Cryptopolitan.com holds no liability for any investments made based on the information provided on this page. We strongly recommend independent research and/or consultation with a qualified professional before making any investment decisions.
- 000
- 2022
- 9
- a
- Action
- advice
- All
- analysis
- average
- bearish
- Bears
- before
- being
- between
- Bitcoin
- Bitcoin Price
- Bitcoin Price Analysis
- BTC
- BTC/USD
- Bulls
- caused
- Charts
- closer
- Coins
- create
- created
- crypto
- Crypto Market
- Current
- daily
- decisions
- Despite
- dominates
- down
- ends
- Exchanges
- Exit
- Exit Strategy
- extreme
- found
- from
- further
- going
- grinding
- helped
- helping
- High
- Hodlers
- holds
- hopes
- HTTPS
- huge
- independent
- information
- investment
- Investments
- investor
- Investors
- larger
- Level
- levels
- liability
- Long
- long-term
- looking
- made
- major
- Making
- Market
- Matter
- means
- Miners
- Month
- more
- most
- move
- movement
- moving
- Near
- negative
- opportunities
- otherwise
- percent
- picture
- price
- Price Analysis
- professional
- profits
- provided
- qualified
- quickly
- ranging
- recent
- recommend
- reflects
- region
- remains
- research
- Selling
- sentiment
- since
- small
- sold
- Strategy
- support
- Technical
- The
- timeframe
- towards
- trade
- Traders
- Trading
- trajectory
- USD
- value
- Volatility
- week
- worth


