Published 2 days ago
Bitcoin price trades on a lower note as the bulls could not sustain the higher levels. But, this could not be taken as a sign of a bearish probability. The 24-hour trading volume declined by more than 12% to $30,856,174,070, with the fall in the price. As a general rule, a fall in price with volume is a sign of a weak bearish trend. That means market participants are not interested in aggressive selling.
advertisement
- BTC price extends the losses for the fourth straight day.
- However, the buyers find good support at around the $22,000 level.
- A dip buying opportunity for investors as the candlestick formation suggests consolidation.
As of writing, BTC/USD reads at $22,278, down 1.90% for the day.
BTC price trades sideways

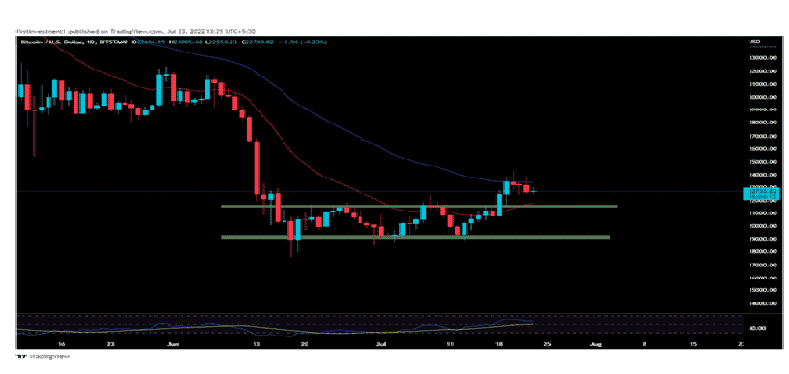
On the daily time frame, after giving a bullish breakout, the BTC price faces rejection near $24,270. This also coincides with the critical 50-day EMA (Exponential Moving Average). Thus making it a crucial level to trade.
In addition to that, the formation of multiple Doji candlesticks indicates indecision among investors. For the past four-session, the price has been consolidating in a range of $$22,300 and $24,300.
Trending Stories
The bulls would take the front seat once again if the next candlestick gives a daily close above $23,000, the high of the previous session. However, to sustain and continue with upside momentum more buyers are needed. An aggressive buying could take off the $26,000 mark.


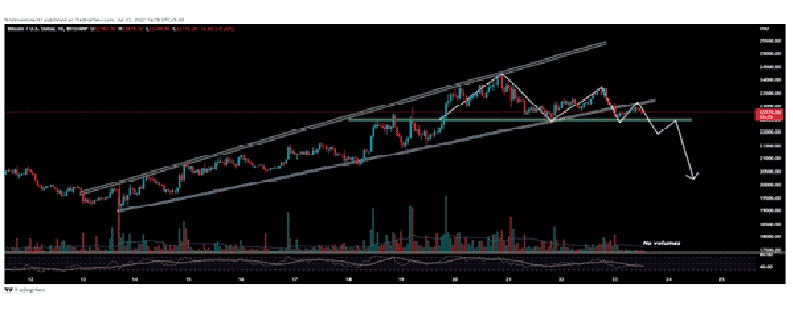
On the hourly chart, BTC breaks the lower trend line of the ascending channel, indicating a probable correction is on the cards. Further, the volume and price contraction pattern is forming near the higher levels. To sum up, bears capped the gains in the lower time frame.
If the price breaks it’s intraday low, then, we expect a good fall up to $21,800.
advertisement
Conclusion:
BTC could continue with its consolidation and little corrective pullback. However, traders are advised to enter the long position near the lower levels to capitalize on the fall.
Share this article on:
The presented content may include the personal opinion of the author and is subject to market condition. Do your market research before investing in cryptocurrencies. The author or the publication does not hold any responsibility for your personal financial loss.
- Bitcoin
- Bitcoin Price Analysis
- blockchain
- blockchain compliance
- blockchain conference
- coinbase
- Coingape
- coingenius
- Consensus
- crypto conference
- crypto mining
- cryptocurrency
- decentralized
- DeFi
- Digital Assets
- ethereum
- machine learning
- non fungible token
- plato
- plato ai
- Plato Data Intelligence
- Platoblockchain
- PlatoData
- platogaming
- Polygon
- Price Analysis
- proof of stake
- W3
- zephyrnet


