SNEAK PEEK
- The TD Sequential indicator has presented a sell signal on the Chainlink daily chart.
- LINK could be approaching a correction to $8.10 or even lower price points.
- A daily close above $8.80 is required for Chainlink’s price in order to invalidate the bearish formation and continue the uptrend.
Chainlink appears to be headed for a correction, as the TD Sequential indicator has presented a sell signal on its daily chart. If LINK is unable to break through and close above $8.80, it could be heading for a price dip to as low as $8.10 or even lower.
To keep its uptrend going, Chainlink will need to close above the resistance level of $8.80 and turn the bearish formation around. Investors should watch this closely in order to buy during any dips that occur.
Chainlink Price Analysis
Today’s Chainlink price analysis shows a decline in LINK’s price action as it touched a high of $8.73 and has since fallen to around $8.43 at the time of writing. LINK has been trading in an uptrend pattern for the last week before the bears took control of the market, driving the price down.
The bearish divergence in LINK’s market has been fueled by the increase in selling pressure, which views the current price level as a good opportunity to short LINK. This has caused the TD Sequential indicator to present a sell signal on the daily chart, which could potentially signal a correction in LINK’s price action over the next couple of days.
To invalidate this bearish formation and continue its uptrend, Chainlink will need to break through the present resistance level of $8.73 and close above it. If not, LINK could be headed for a price dip toward the support level at $8.00 or even lower levels. Traders should watch this closely in order to capitalize on any dips that occur due to the bearish formation.

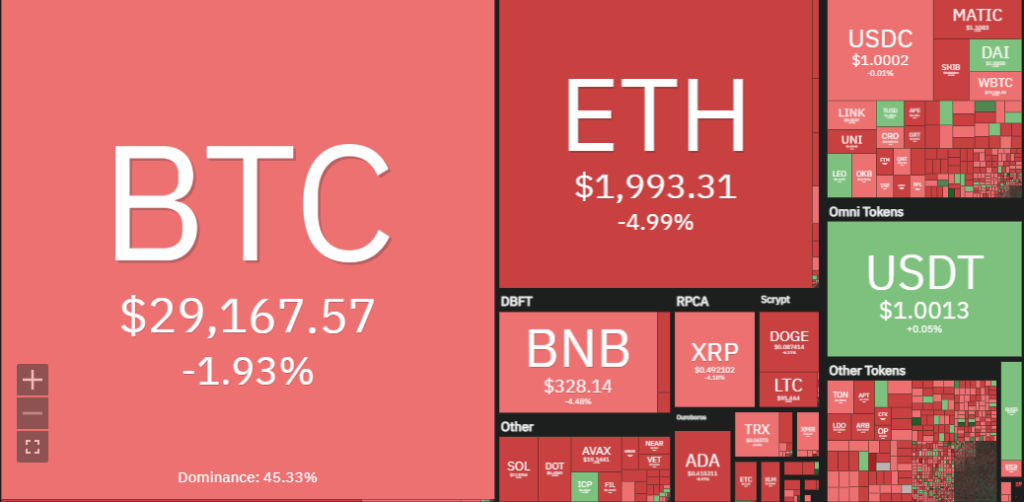
As the crypto market is facing a bearish sentiment, LINK could not be an exception. Major coins such as Bitcoin and Ethereum are also in decline, with BTC dropping below the $30K mark and ETH having dipped below $2K levels, having lost 1.93% and 4.99% respectively in terms of market capitalization.
On the daily chart, the Chainlink market has shifted drastically as the bears are controlling the market. The buying pressure has decreased and the selling pressure is increasing. Chainlink’s market cap stands at $4.17 billion with a 24-hour volume of $564 million and is trading at $8.43 as of the writing of this article.
The technical indicators on the 1-day chart display a decline as the Moving Average Convergence Divergence (MACD) indicator is losing its bullish momentum. The MACD line has lost its uptrend look and changed direction, which could turn into a bearish crossover in the market if the buyers don’t regain the market.
The Relative Strength Index (RSI) has also fallen off from the overbought zone, with the current value standing at 59.11, and entered a neutral state, signaling a bearish pressure in LINK’s price action. The moving average (MA) indicator also confirms the bearishness in LINK’s market as the green candlesticks are slowly shifting away from the blue line and red candlesticks are forming, indicating a decline in LINK’s price action.
In conclusion, Chainlink appears to be heading for a correction, as the TD Sequential indicator has presented a sell signal on its daily chart. The bearish trend is in control of the market, and it appears that LINK will need to break through and close above $8.80 in order to invalidate the bearish formation and continue the uptrend.
Disclaimer: Cryptocurrency price is highly speculative and volatile, and should not be considered financial advice. Past and current performance is not indicative of future results. Always do your own research and consult with a financial advisor before making investment decisions.
- SEO Powered Content & PR Distribution. Get Amplified Today.
- Platoblockchain. Web3 Metaverse Intelligence. Knowledge Amplified. Access Here.
- Minting the Future w Adryenn Ashley. Access Here.
- Source: https://investorbites.com/chainlink-link-price-analysis-19-04/
- :has
- :is
- :not
- 1
- 10
- 11
- 7
- a
- above
- Action
- advice
- advisor
- also
- always
- an
- analysis
- and
- any
- approaching
- ARE
- around
- article
- AS
- At
- average
- BE
- bearish
- bearish divergence
- Bears
- been
- before
- below
- Billion
- Bitcoin
- Bitcoin News
- Blue
- Break
- Bullish
- buy
- buyers
- Buying
- by
- cap
- capitalization
- capitalize
- caused
- Chainlink
- Chainlink price analysis
- Chart
- Close
- closely
- Coins
- conclusion
- considered
- continue
- control
- controlling
- Convergence
- could
- Couple
- crypto
- Crypto Market
- cryptocurrencies
- cryptocurrency
- Cryptocurrency Price
- Current
- daily
- Days
- decisions
- Decline
- Dip
- direction
- discussion
- Display
- Divergence
- Dont
- down
- drastically
- driving
- Dropping
- during
- entered
- ethereum
- Ethereum News
- Even
- exception
- extensive
- external
- facing
- Fallen
- financial
- financial advice
- For
- formation
- from
- future
- going
- good
- Green
- having
- headed
- Heading
- High
- highly
- HTTPS
- in
- Increase
- increasing
- index
- Indicator
- Indicators
- internal
- into
- investment
- Investors
- IT
- ITS
- Keep
- Last
- Level
- levels
- Line
- LINK
- Look
- losing
- Low
- MACD
- major
- Making
- mark
- Market
- Market Cap
- Market Capitalization
- Market News
- max-width
- million
- Momentum
- moving
- moving average
- Need
- Neutral
- news
- next
- of
- on
- Opportunity
- or
- order
- over
- own
- past
- Pattern
- performance
- plato
- Plato Data Intelligence
- PlatoData
- points
- potential
- potentially
- present
- presented
- pressure
- price
- PRICE ACTION
- Price Analysis
- Red
- relative strength index
- required
- research
- Resistance
- Results
- rsi
- sell
- Selling
- sentiment
- SHIFTING
- Short
- should
- Shows
- Signal
- signals
- since
- Slowly
- Source
- stands
- State
- strength
- such
- support
- support level
- TD
- TD Sequential
- Technical
- terms
- that
- The
- this
- Through
- time
- to
- touched
- toward
- Traders
- Trading
- Trend
- TURN
- uptrend
- value
- views
- volatile
- volume
- Watch
- week
- What
- What is
- What is bitcoin
- which
- will
- with
- writing
- Your
- zephyrnet


