Published 10 mins ago
The Cardano(ADA) price plunged dramatically over the last few days resulting in a breakdown of the parallel channel pattern and a 22.6% drop. Thus, the increased selling pressure results in the fallout of the crucial supporting EMAs planning to breach the $0.45 support level. So, is this an opportunity to buy the dip, or will the downtrend continue below the $0.4 mark?
advertisement
Key points:
- The channel pattern breakdown indicates the continuation of the ongoing range-bound rally
- The coin buyers lose the dynamics support of the 20-day EMA
- The intraday trading volume in the ADA coin is $103.6 Billion, indicating a 104.6% gain.

 Source- Tradingview
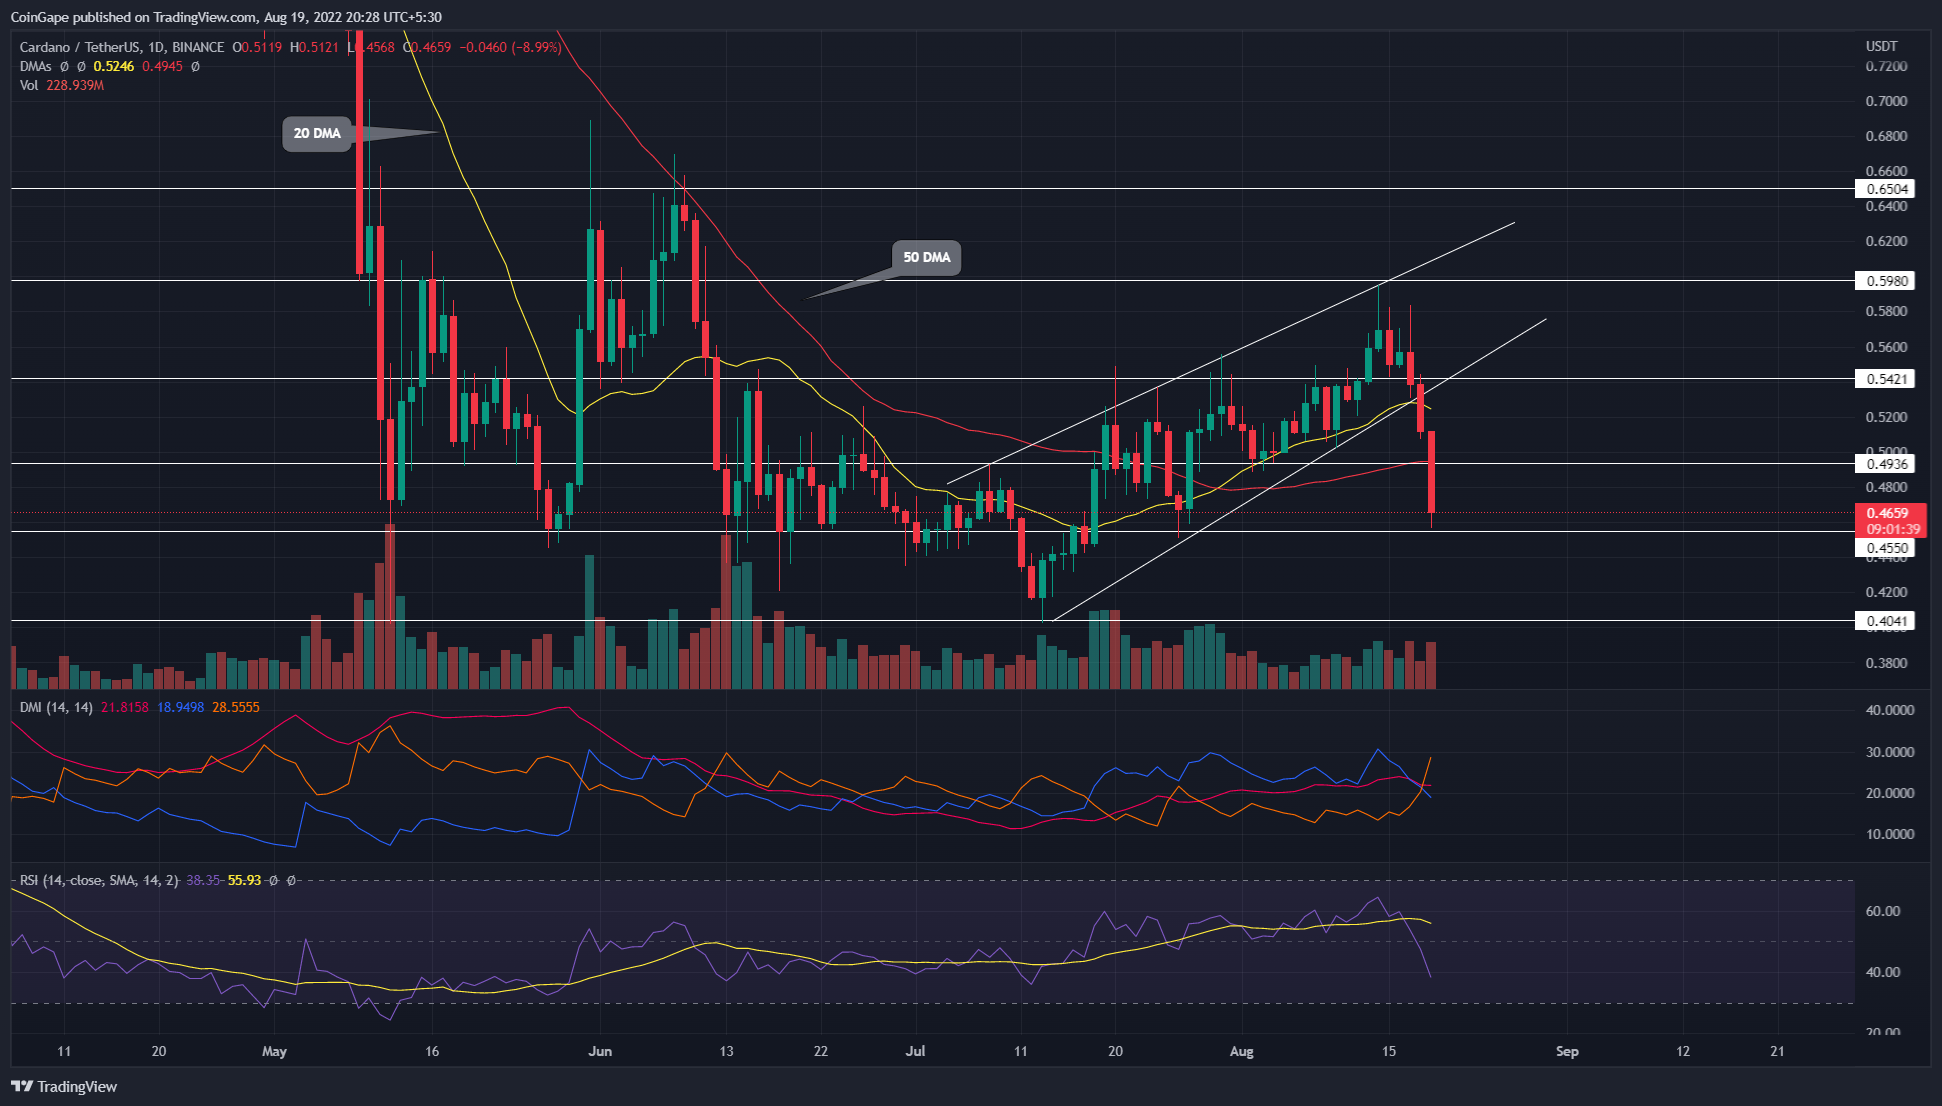
The ADA/USD price chart displays the bullish reversal from the $0.4 mark within a rising channel pattern accounting for a price jump of 47.5%. However, the recent higher price rejection from the $$0.595 mark accounts for a 22.6% price drop, breaking below the support trendline.
The price action displays a triple black crow pattern forming in the daily chart struggling to take support at the $0.45 mark. Furthermore, the increase in selling pressure is evident with the spike in intraday trading volume and the long-wick candles.
Trending Stories
The growing bearish influence over the daily chart increases the possibility of a downtrend continuation below the support level of $0.45. Therefore, a short-selling opportunity will arise with the breakdown of the aforementioned support with the potential of a 13% drop to revisit the July low of $0.4 mark.
On the contrary, a bullish reversal with a lower price rejection from the $0.45 support level might result in a price jump above the 50-day EMA.
Technical Indicator
DMI indicator: The sudden increase in selling pressure results in a bearish crossover in the DI lines, with a sharp drop in the bullish momentum evident by the ADX line.
advertisement
Relative strength index: the daily RSI slope displays a phenomenal increase in the underlying bearishness as it drops below the halfway line and the 14 days average line.
- Resistance levels- $0.5, and $0.542
- Support levels- $0.45 and $0.4
Share this article on:
The presented content may include the personal opinion of the author and is subject to market condition. Do your market research before investing in cryptocurrencies. The author or the publication does not hold any responsibility for your personal financial loss.
- Bitcoin
- blockchain
- blockchain compliance
- blockchain conference
- Cardano (ADA)
- Cardano price analysis
- coinbase
- Coingape
- coingenius
- Consensus
- crypto conference
- crypto mining
- cryptocurrency
- decentralized
- DeFi
- Digital Assets
- ethereum
- machine learning
- non fungible token
- plato
- plato ai
- Plato Data Intelligence
- Platoblockchain
- PlatoData
- platogaming
- Polygon
- proof of stake
- W3
- zephyrnet


