The post In the Middle of the Bear Market, Bitcoin(BTC) prices Project A 15% Upswing to Hit $24,000 appeared first on Coinpedia – Fintech & Cryptocurreny News Media| Crypto Guide
Bitcoin price nowadays is experiencing massive bearish pressure as the prices are failing to gain bullish momentum. The traders just want to liquidate each time the price ignites to drop towards the lower support. No doubt, the BTC prices are not dropping below $20,200, but are unable to make it above $22,500 either. Amid the hasty clouds of uncertainty, minor possibilities of a bounce-back emerges that may rise the price beyond $23,000 very soon.
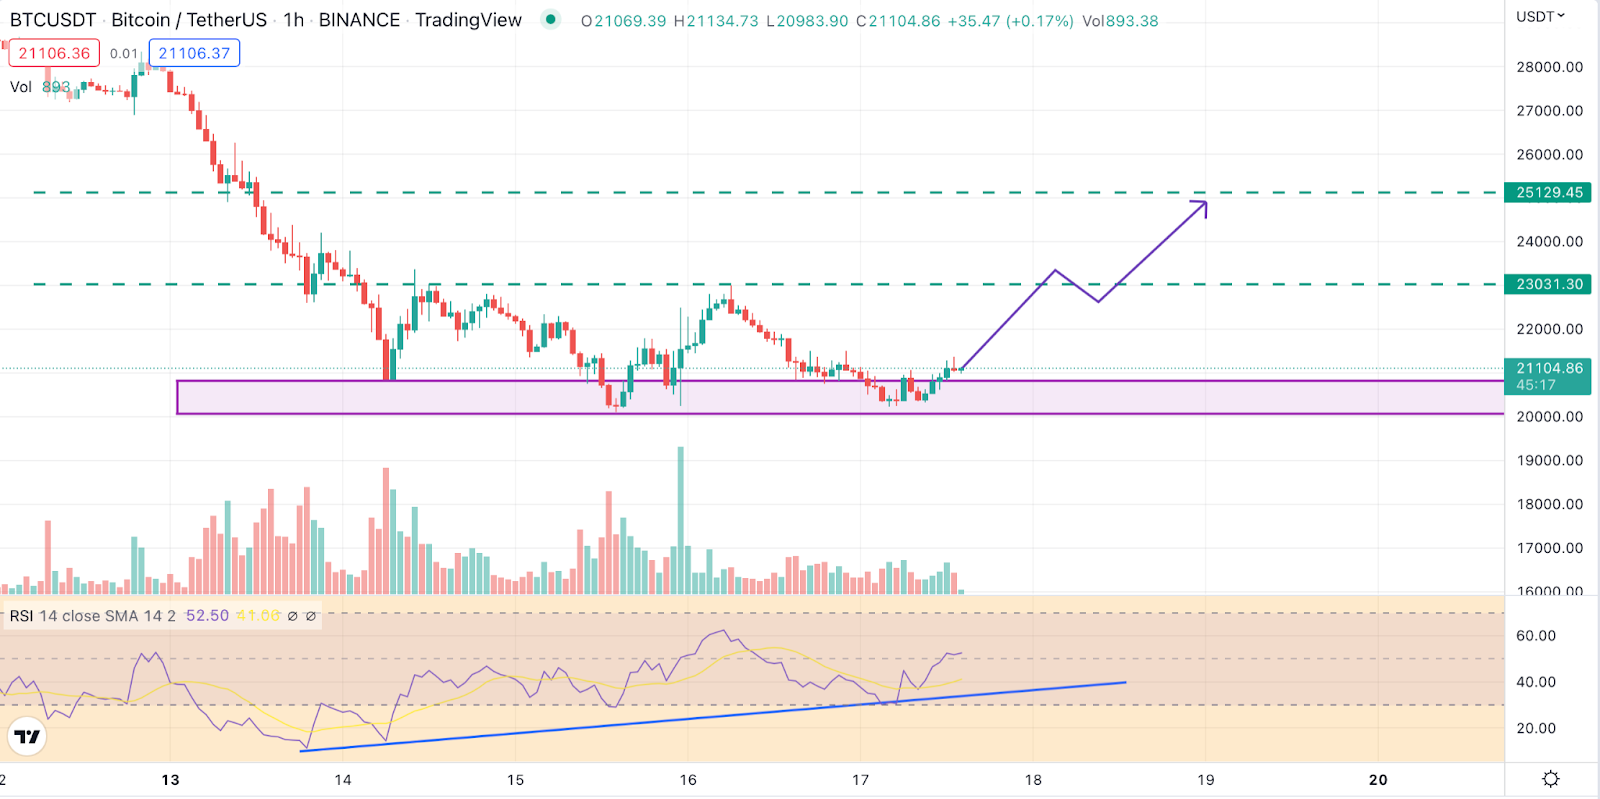
The BTC price with the recent bounce from $20,200 levels has validated a bullish divergence within the price and also the RSI levels. Therefore, the asset is expected to slice through the narrow consolidation and quickly gain the value above $23,000 initially and later head on to test the next resistance at $25,000.

The above hourly chart of BTC price displays the growing bullish momentum that has capped the support at around $20,200. On the other hand, the RSI is maintaining a significant uptrend, while prices also react positively. Therefore, a collective effort may eventually rise the price beyond the interim barrier at $22,500 to achieve $23,000. Once these levels are secured, then the BTC may be assumed to be on the path to flipping the bears which may be accomplished after reaching above $25,000.
Also Read: Will Bitcoin Price Hit $18K In Coming Hours? Here Are Levels To Watch
This May be When Bitcoin(BTC) Price Could Rebound!
Yet another bullish case emerges for the star crypto as the historical data reveals the price to follow a particular pattern and hence the recent price drain is also a part of it. The BTC price has previously dropped hard and maintained a bearish trend for months together which eventually resulted in a breakout. The BTC price has always surged and formed a new ATH following a breakout.
In the above chart put up by the analyst decodes the pattern followed by BTC price during each bearish trend. The asset earlier had plunged heavily below the 20-Month MA levels and consolidated for 2 to 4 months. In 2015 prices consolidated for 4 months while in 2018 for just 2 months. Currently, Bitcoin has already consolidated for 2 months and hence a massive price action may be fast approaching.
On the contrary, if the asset fails to break out of the bearish trend now, then it may continue with the consolidation below 20-month MA levels for another couple of months ahead. In such a case, Bitcoin’s (BTC) price could test the same support levels multiple times and weaken it. This may result in a severe breakdown, dragging the price to the much-awaited levels below $15,000.
- "
- &
- 000
- a
- Achieve
- Action
- ahead
- already
- always
- Amid
- analyst
- Another
- approaching
- around
- asset
- barrier
- Bear Market
- bearish
- Bears
- below
- Beyond
- Bitcoin
- Bitcoin Price
- Block
- Breakdown
- breakout
- BTC
- btc price
- Bullish
- case
- coming
- consolidation
- continue
- could
- Couple
- crypto
- Currently
- data
- Display
- displays
- Drop
- dropped
- during
- each
- effort
- eventually
- expected
- experiencing
- FAST
- fintech
- First
- follow
- following
- from
- Growing
- head
- heavily
- here
- historical
- HTTPS
- IT
- levels
- Long
- make
- Market
- massive
- Momentum
- months
- multiple
- news
- next
- Other
- part
- particular
- Pattern
- possibilities
- pressure
- price
- project
- quickly
- reached
- React
- recent
- Reveals
- same
- Secured
- significant
- Star
- support
- test
- The
- therefore
- Through
- time
- times
- together
- towards
- Traders
- Uncertainty
- validated
- value
- while
- within


