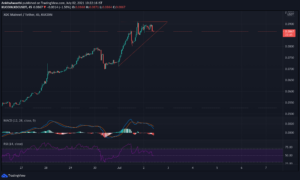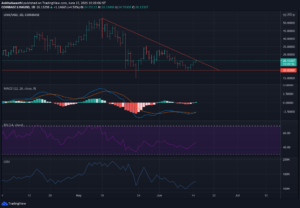
The KDA coin price shows bullish growth resulting in the breakout of $6 horizontal level. However, the lack of trend momentum warns a reversal shortly. Kadena claims that its platform is able to process an astounding 480,000 transactions per second, with 20 chains within its Chainweb structure. The speed may even rise when new chains become part of the chain. Kadena’s energy efficiency improves when it expands and also the transaction costs are very low. Companies that utilize Kadena can cut down on transaction costs entirely by using its cryptocurrency gas station. Consumers pay minimal transaction fees. Let us move ahead to read about KDA technical analysis. Past Performance of KDA The KDA coin price shows a growth of more than 30% after making multiple lower price rejection candles in the past week. The price jump breaks above the horizontal level at $6 resulting in a bullish candle of 7% jump in the past 24 hours. However, the relatively weaker trend momentum to the previous downfall threatens a bearish continuation. KDA/USD Daily Chart KDA Technical Analysis The KDA coin price shows the possibility of a fresh lower high formation with the recent bullish retracement. Moreover, the lack of bullish commitment is evident by the 20% jump in the intraday trading volume. The crucial Exponential Moving averages show a bearish crossover of the 50 and 100-day averages as the price broke below the 200-day EMA. Moreover, the recent price jump can be the retest of the 200-day EMA. The DMI Indicator shows a drastic fall in the trend momentum as the ADX line touches the 15% mark. However, the fall in -DI with the rising +DI increases the possibility of the bullish crossover. The MACD Indicator shows a rapid reversal in the MACD line as it gives a bullish crossover with the signal line. Furthermore, the lines show a bullish divergence in action between the last two dips. Therefore, the increased chances of a bullish continuation in the KDA coin price will need to surpass the selling pressure at 200-day EMA. Upcoming Trend The KDA technical analysis shows the coin price jump resulting in the consolidation range and the psychological level of $6 breakout. However, the reversal from the 200-day EMA remains a threat that can undermine the bullish reversal. Therefore, buyers at the current prices can target the 200-day EMA at $7.6. However, in case the sellers take over, a new lower low formation near $4 is possible. At press time, TradingView gives a “SELL” signal for the KDA coin. Technical Analysis for KDAUSD by TradingView { “interval”: “1D”, “width”: “100%”, “isTransparent”: false, “height”: “100%”, “symbol”: “KDAUSD”, “showIntervalTabs”: true, “locale”: “in”, “colorTheme”: “dark” }
The post KDA Technical Analysis: Another Lower High Peak Or Trend Reversal? appeared first on Cryptoknowmics-Crypto News and Media Platform.
- "
- 000
- About
- Action
- analysis
- bearish
- breakout
- Bullish
- chances
- claims
- Coin
- commitment
- Companies
- consolidation
- Consumers
- Costs
- cryptocurrency
- Current
- Display
- down
- efficiency
- EMA
- energy
- expands
- Fees
- First
- fresh
- GAS
- Growth
- High
- HTTPS
- increased
- IT
- jump
- Level
- Line
- Making
- mark
- Media
- Momentum
- move
- Near
- news
- Pay
- performance
- platform
- press
- pressure
- price
- process
- range
- Sellers
- speed
- Target
- Technical
- Technical Analysis
- time
- Trading
- transaction
- Transactions
- us
- volume
- week
- within


