The market is still in shock due to the deep collapse in recent days. Investors are skeptical, and it remains to be seen when the bulls will return to the market.
Technical Analysis
By Grizzly
The Daily Chart
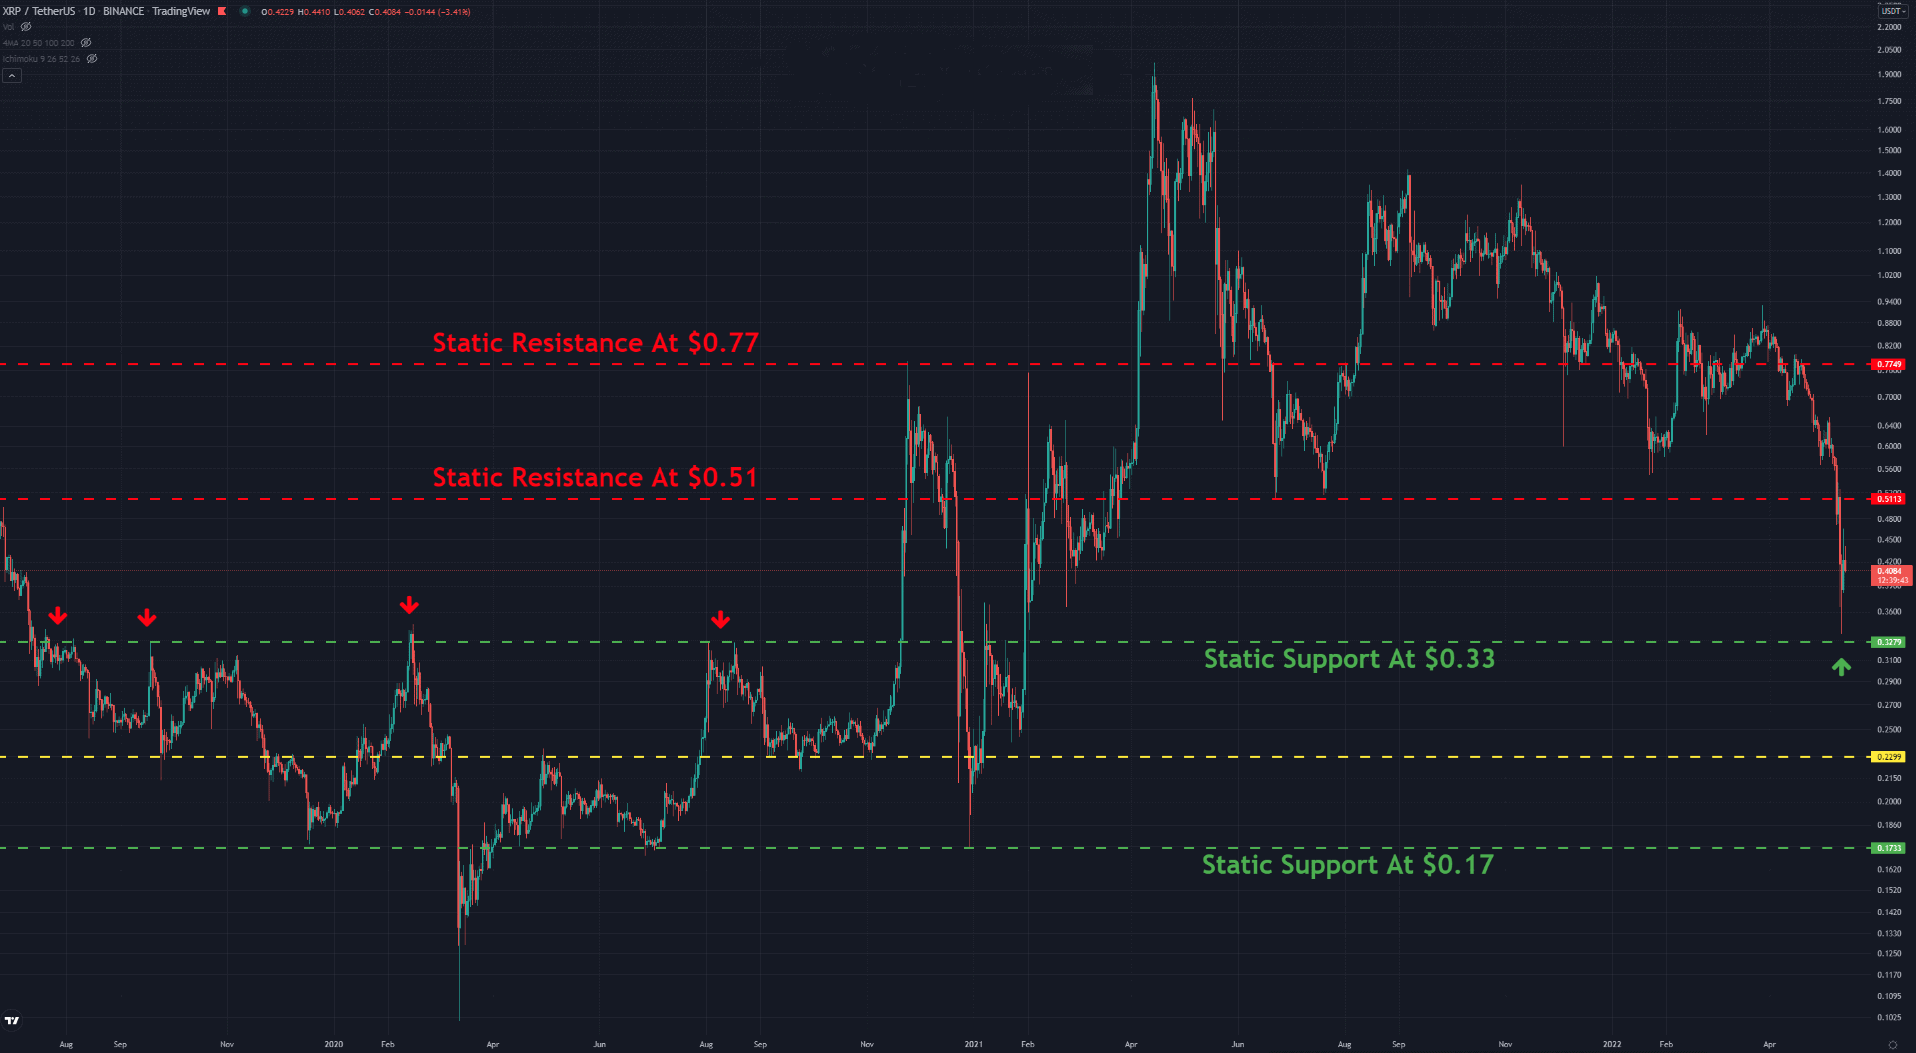
The bears were able to push the price down to critical horizontal support at $0.33. This level has played an essential role for XRP since 2019.

The sharp upward trend in 2021 occurred after breaking this level. If the bulls can defend it, one can expect XRP to move towards the resistance at $0.5, which is the first challenge for the bulls. However, given the macroeconomic conditions in the market, one must remain very careful and cautious.
Key Support Levels: $0.23 & $0.17
Key Resistance Levels: $0.51 & $0.77
Moving Averages:
MA20: $0.56
MA50: $0.69
MA100: $0.73
MA200: $0.81
The XRP/BTC Chart
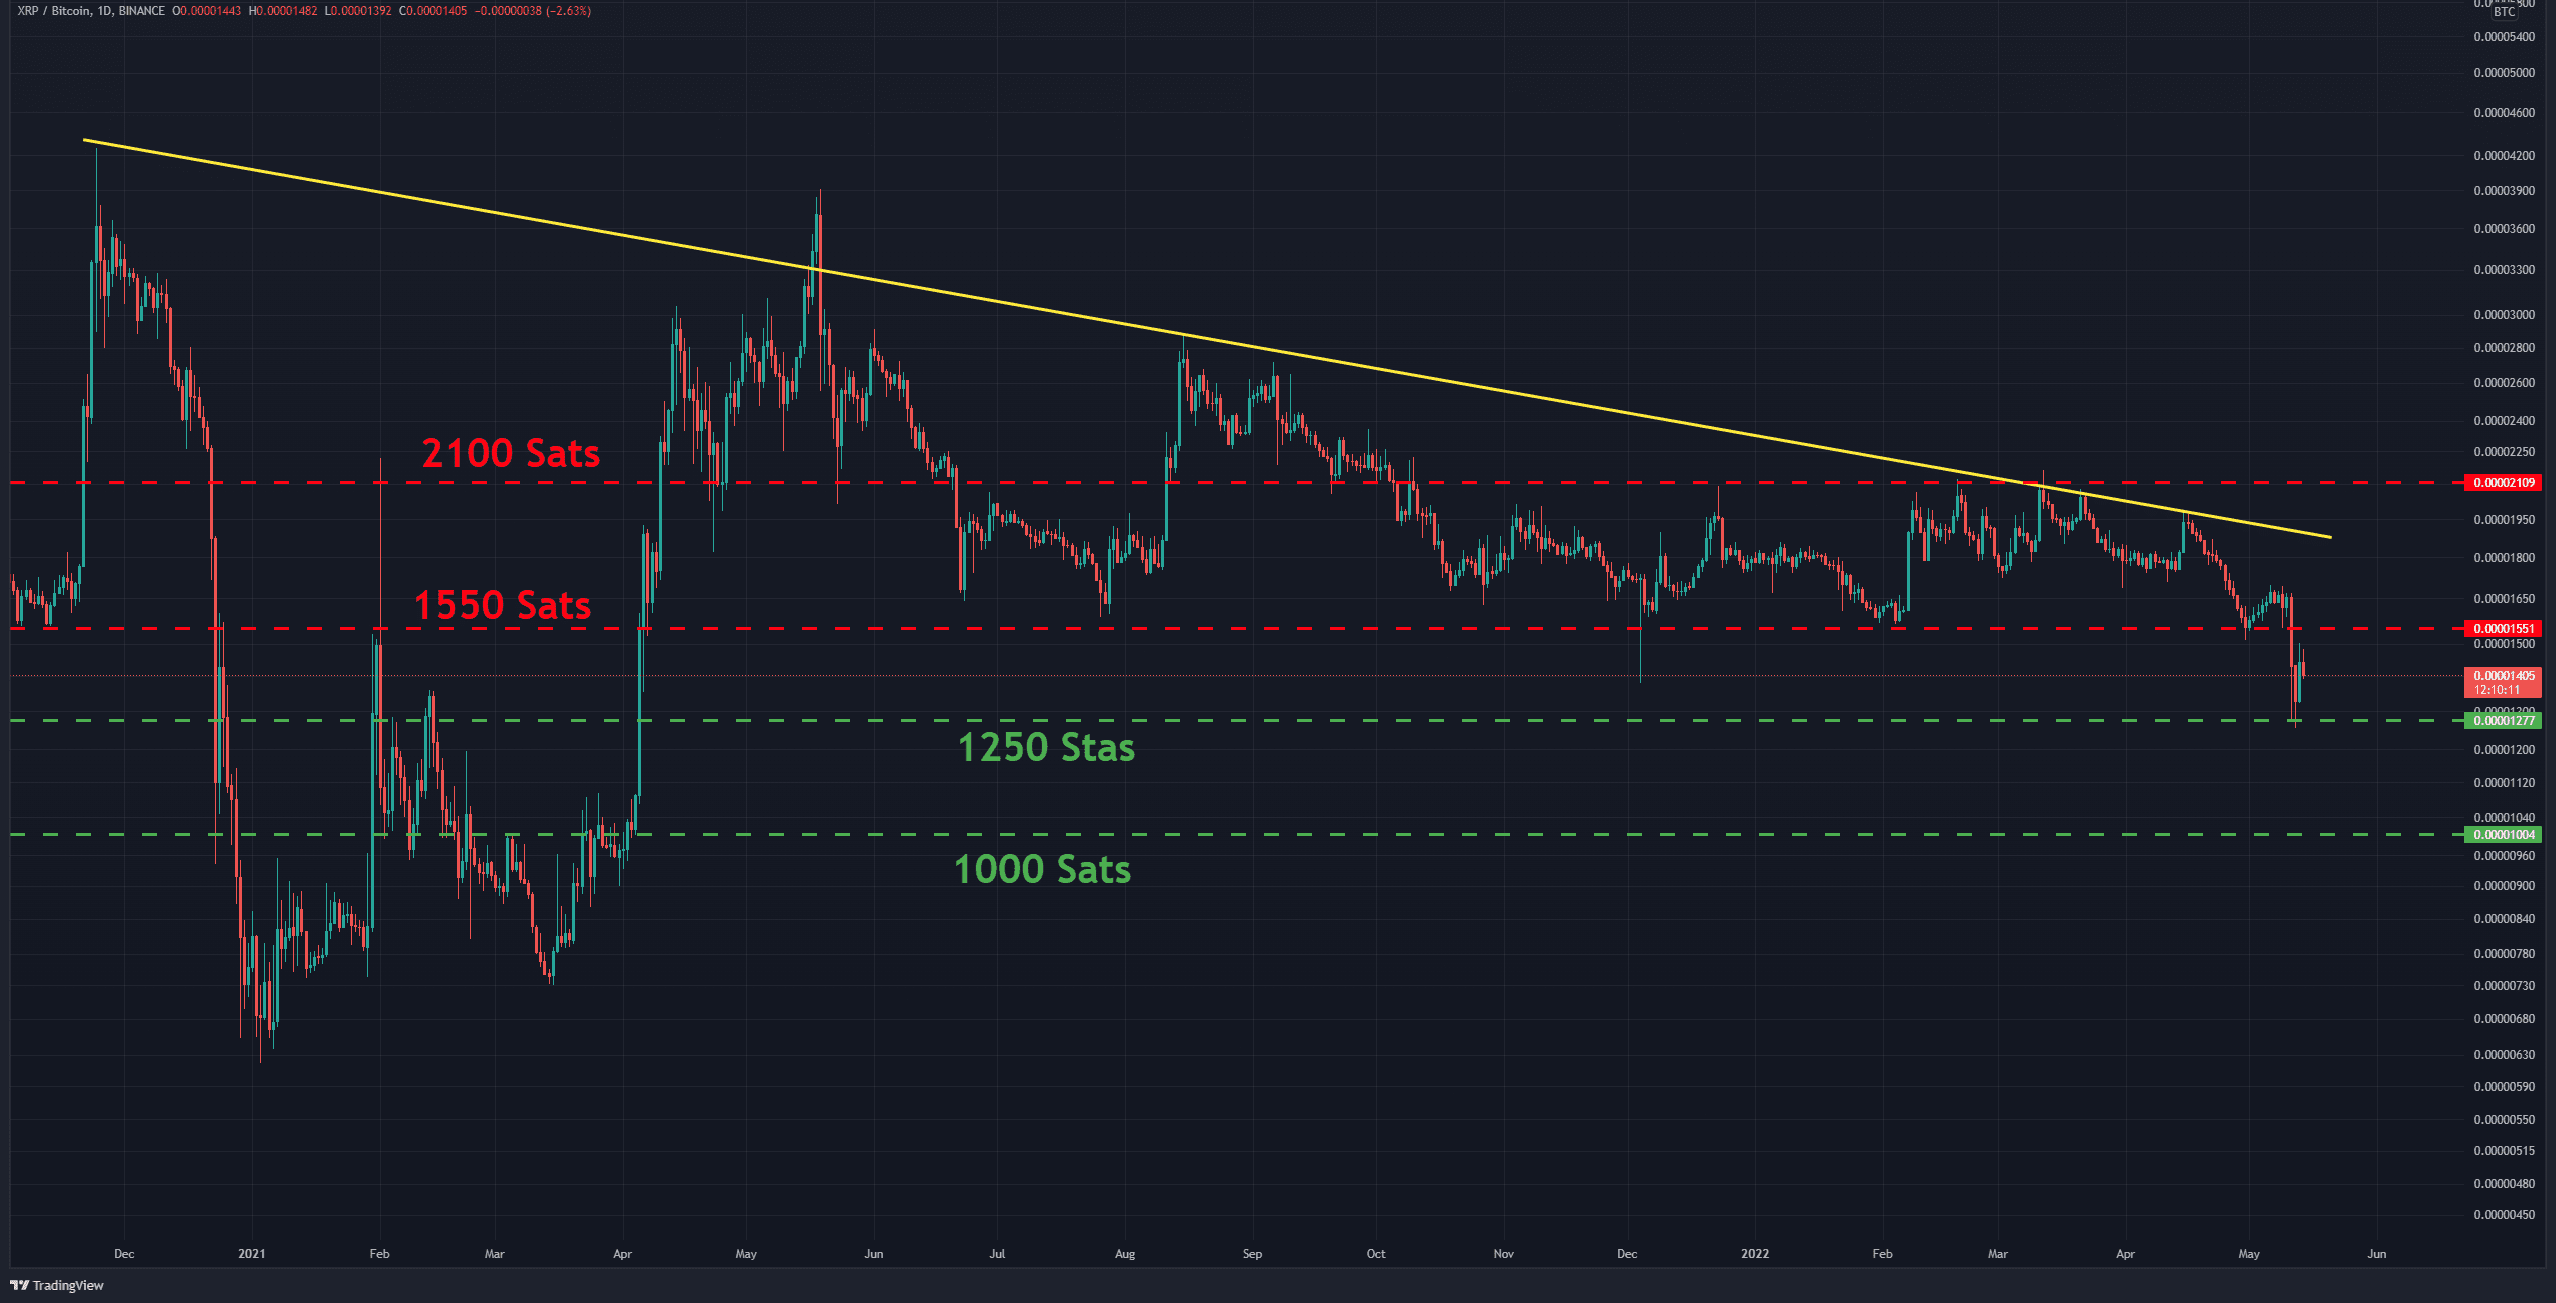
Against BTC, the price has lost the critical support at 1550 SATS, which has now turned into resistance. Considering the huge sell-off, returning the price to higher levels will not be easy. First, the selling pressure must be reduced. Then market usually enters an accumulation or transition phase until the next major leg. There is still selling pressure in the market now, although not as much as in the past few days.

- Coinsmart. Europe’s Best Bitcoin and Crypto Exchange.
- Platoblockchain. Web3 Metaverse Intelligence. Knowledge Amplified. FREE ACCESS.
- CryptoHawk. Altcoin Radar. Free Trial.
- Source: https://cryptopotato.com/ripple-sits-at-a-long-term-support-following-30-weekly-crash-rebound-in-sight-xrp-technical-analysis/


