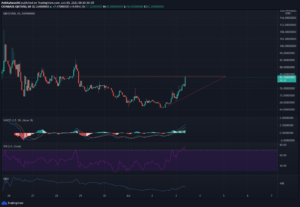
SAND coin price fails to continue the retest rally and falls below the 50 and 100-day EMAs. Is this the start of another downtrend? The SAND coin price retests the cup and handle breakout at the $4 support zone resulting in a rally above the 50-day EMA. However, the buyers fail to sustain the uptrend and retrace back to the $4 mark. Will this downfall result in a breakout below $4? Key technical points: The coin price retests the $4 mark. The MACD indicator shows the MACD and signal lines merging near the zero mark. The 24-hour trading volume in the SandBox token is $1.04 Billion, indicating a 5.38% fall. Past Performance of SAND With the SAND coin price breaking above the cup and handle, the rally hits the $4.88 mark but fails to continue the uptrend resulting in a downfall. The downfall retests the neckline of the cup and handle pattern at $4. The post-retest reversal bounces above to the $4.40 but the sudden rise in selling pressure kicks the price back to the $4 support zone. Currently, the SAND coin price trades at $4.05, with a price fall of 5.68% in the last 24 hours as the selling pressure grows. Source-Tradingview SAND Technical Analysis The SAND coin price action creates a symmetrical triangle pattern in the daily chart. Presently, the price rests near the support trendline and the $4 support zone. Hence, the confluence of such demand-rich support areas indicates a high possibility of a bullish reversal. The flattish 50-and-100-EMA accentuates a sideways movement in the SAND price. However, the price has recently plunged below these EMAs which indicates the traders are aggressively selling. The RSI Indicator slope turns down from the 14-SMA line and slips below the equilibrium. This indicates the negative sentiment rising in the market. The MACD indicator showcases the fast and slow were on the verge of crossing above the neutral zone. However, the recent retracement in price action threatens a bearish crossover among these lines, providing an extra edge to short-traders. In a nutshell, the technical indicators indicate bears are strengthening their grip. Upcoming Trend The SAND coin price trends lower and rests near the support trendline of the triangle pattern. However, the rise in selling pressure evident by the technical indicators project the break down of $4. Therefore, traders can find selling opportunities with the breakdown of $4. Support Levels:$3.5 and $3.15 Resistance Levels: $4.84 and $5.5
The post SAND Technical Analysis: Bearish Attack Ruins The Retest Rally appeared first on Cryptoknowmics-Crypto News and Media Platform.
- "
- 84
- Action
- among
- analysis
- Another
- bearish
- Bears
- Billion
- breakout
- Bullish
- Coin
- continue
- Display
- down
- Edge
- EMA
- FAST
- First
- High
- HTTPS
- Key
- Line
- mark
- Market
- Media
- movement
- Near
- news
- opportunities
- Pattern
- performance
- possibility
- pressure
- price
- project
- rally
- sandbox
- sentiment
- start
- support
- Symmetrical Triangle
- Technical
- Technical Analysis
- token
- Traders
- trades
- Trading
- Trends
- volume
- zero


