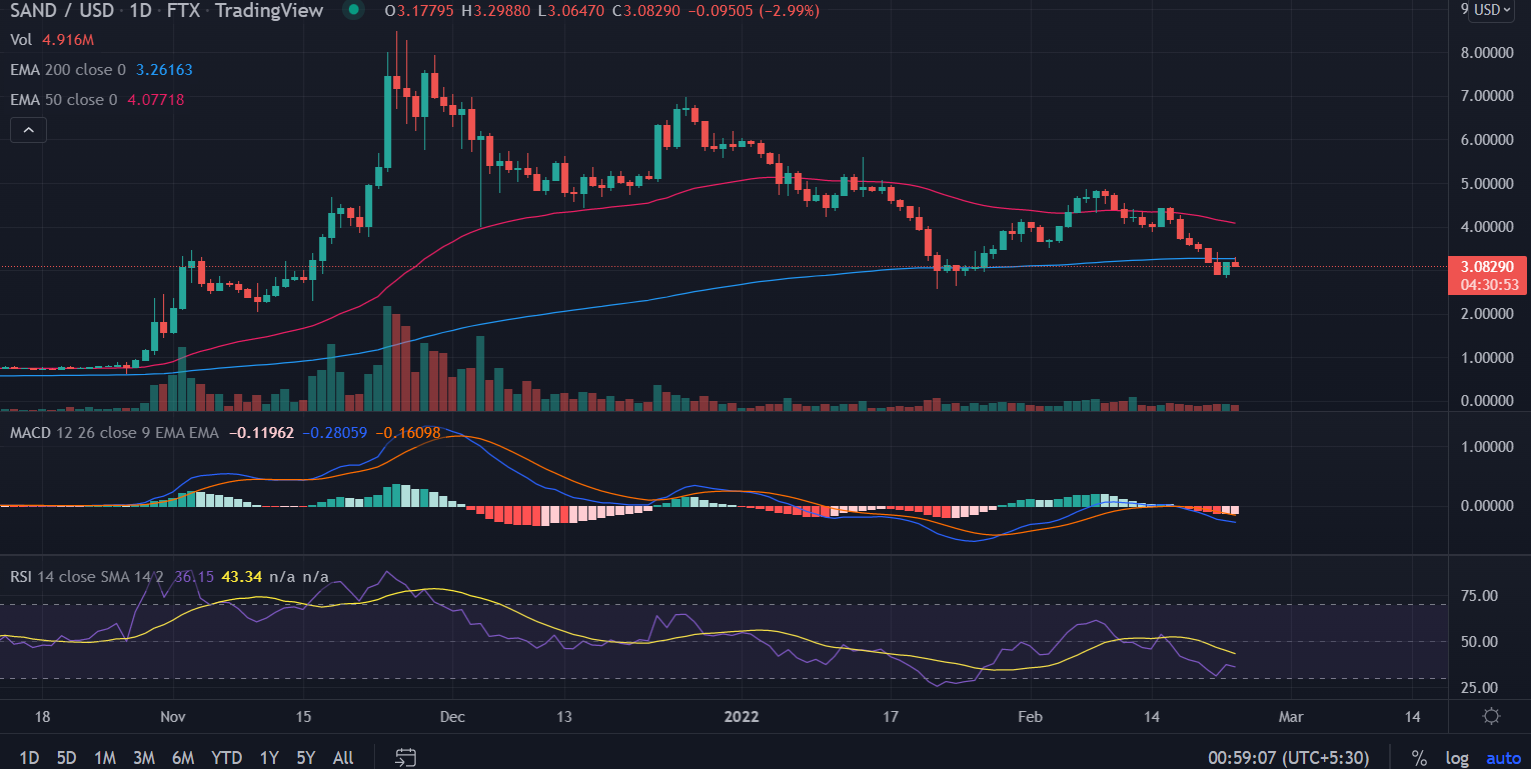
Sandbox (SAND) price fails to capitalize on the previous session’s gains. SAND is falling continuously since February 16 slicing critical moving averages. The recent price action has re-entered the $2.82 and $3.08 demand zone.
- Sandbox (SAND) price edges lower on Wednesday.
- SAND remains pressured below critical 50-day and 200-day EMA.
- RSI trades near oversold territory but still, the market is far from cooling off.
As of writing, SAND/USD is trading at $3.08, down 2.93% for the day.
In the recent update, the Sandbox one of the top blockchain-based metaverse game experiences launched 10,000 Snoop Dogg avatar NFTs on Tuesday. However, the metaverse coin remains unfazed by the news.
SAND looks for the sign for reversal

On the daily chart, Sandbox (SAND) price action is near a crucial point after its recent crash where it might set for the next directional bias. SAND has nose-dived almost 45% since February 16 and has pierced through the critical moving averages placed at 200 and 50-day EMAs.
However, the recent retracement is possibly a sign to make a U-turn, therefore, and then begin an ascent toward the psychological $4.0 level. Next, market participants could test the weekly resistance barrier at $4.71 in a highly optimistic scenario.
On the flip side, a spike in sell orders could see SAND breach the session’s low of $3.06 resulting in the continuation of the downtrend. Furthermore, a daily candlestick close below $2.62 would create a lower low and invalidate the bullish outlook.
Investors would like to explore to $2.30, levels last seen in November.
Technical Indicators:
RSI: The Daily Relative Strength Index (RSI) stands at 33 below the average line.
MACD: The Moving Average Convergence Divergence (MACD) hovers below the midline with a bearish bias.
The post Sandbox (SAND) Price Prediction: SAND Remains Pressured Below 200-day EMA, Possibly Could Dive Another 20% appeared first on CoinGape.
- Coinsmart. Europe’s Best Bitcoin and Crypto Exchange.
- Platoblockchain. Web3 Metaverse Intelligence. Knowledge Amplified. FREE ACCESS.
- CryptoHawk. Altcoin Radar. Free Trial.
- Source: https://coingape.com/markets/sandbox-sand-price-prediction-sand-remains-pressured-below-200-day-ema-possibly-could-dive-another-20/


