SNEAK PEEK
- Shiba Inu price is on the rise as market sentiment turns bullish.
- SHIB has surged by nearly 4.45%, bringing its 24-hour high to around $0.00001095.
- The support level for the SHIB/USD is around $0.00001047.
The latest Shiba Inu price analysis is showing a strong recovery from the bearish sentiment of the past few days. SHIB is up nearly 4.45% in the last 24 hours, pushing its price to around $0.00001095. This marks a significant recovery for SHIB, which has generally been trading sideways between levels of $0.00001047 and $0.00001123 for the last 24 hours.
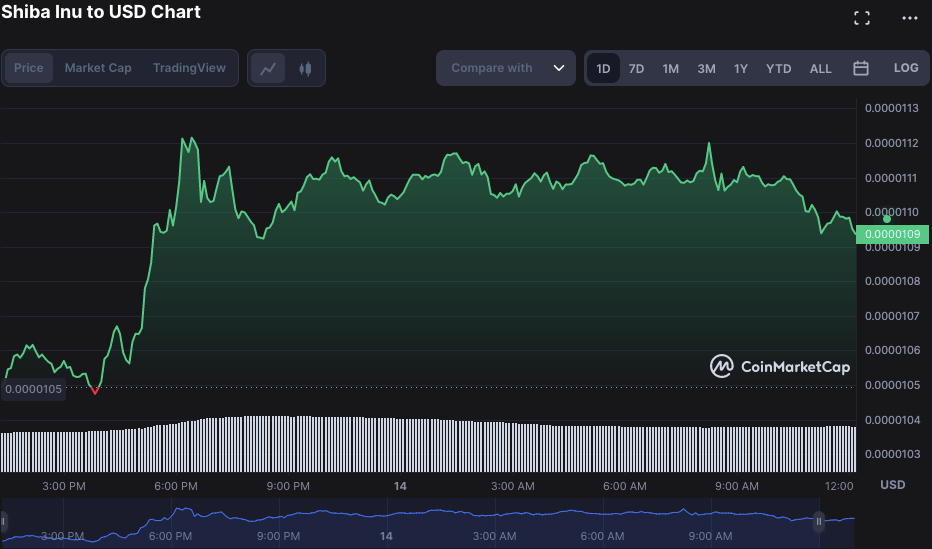
The latest surge in SHIB’s price has been driven by a sharp increase in trading volume; over $370 million worth of SHIB was traded in the last 24 hours alone. This suggests that there is strong interest in the coin, and investors are feeling increasingly bullish about its prospects.
The market cap for SHIB is currently sitting at around $6.03 billion, making it the 15th largest cryptocurrency, according to CoinMarketCap.
The support level for the SHIB/USD pair is around $0.00001047, and any further upward movement will depend on whether buyers can continue to keep up this momentum or not. If they do, then we could see prices break above the resistance level of $0.00001123 and reach a new all-time high.
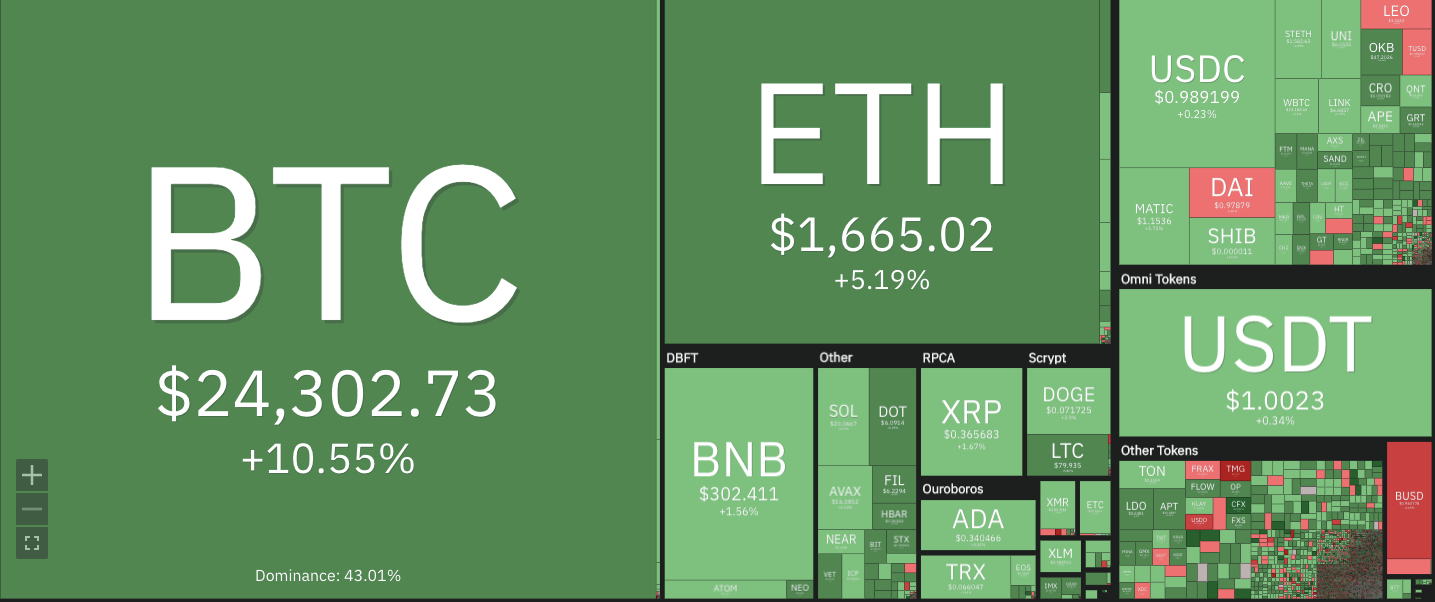
Looking at Coin360, it is clear that the majority of the cryptocurrencies are in green. The top coins like Bitcoin (BTC), Ethereum (ETH), and Binance Coin (BNB) are all showing bullish momentum, which is likely driving the positive market sentiment for SHIB as well as more investors flocking to the coin.
The daily technical indicators for SHIB are also looking good, with the RSI value at 42.71, indicating that the coin is in a healthy bullish state. The green MACD bars in the histogram indicate that SHIB is in an uptrend, and the signal line is expected to crossover with the MACD line soon, further confirming the bullish momentum for the coin.
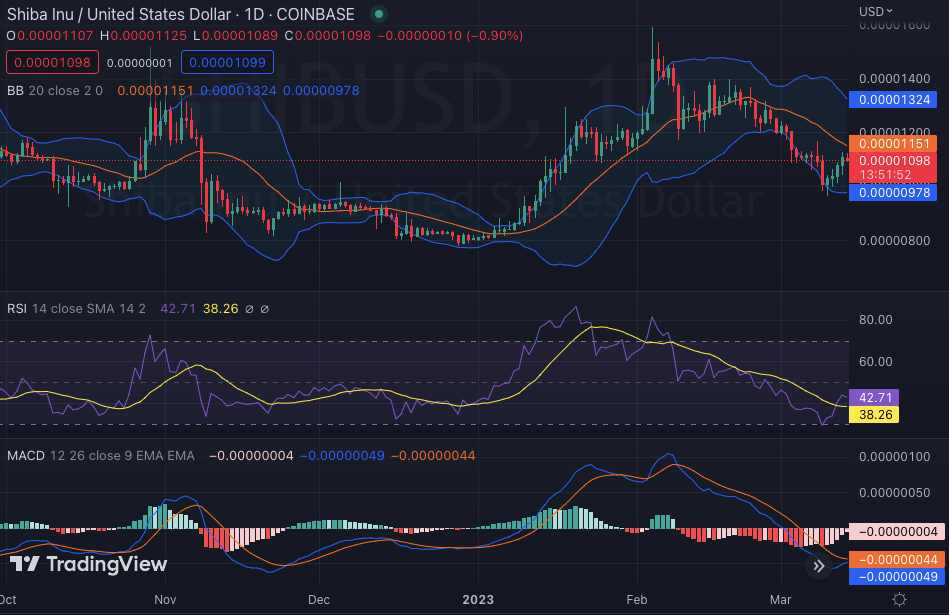
Volatility is high for SHIB, and we could see unexpected price movements in the near future. The Bollinger bands are currently at their widest level, reflecting increased volatility in the market.
The upper Bollinger bands are at $0.00001324, which could be a potential target if the bulls manage to maintain their current momentum, while the lower bound is at $0.00000976, which could be a good entry point for investors looking to buy the dip.
According to the Shiba Inu Price Analysis for 14/03, SHIB is continuing its upward trend and has experienced a surge in trading volume, signaling that investors are feeling increasingly bullish about its potential. The market sentiment for the coin is positive, and with good technical indicators and volatility, there could be further upside in the price of SHIB in the near future.
Disclaimer: Cryptocurrency price analysis is highly speculative and volatile, and should not be considered financial advice. Past and current performance is not indicative of future results. Always do your own research and consult with a financial advisor before making investment decisions.
- SEO Powered Content & PR Distribution. Get Amplified Today.
- Platoblockchain. Web3 Metaverse Intelligence. Knowledge Amplified. Access Here.
- Source: https://investorbites.com/shiba-inu-shib-price-analysis-14-03/
- :is
- $UP
- 1
- 7
- 8
- a
- About
- above
- According
- advice
- advisor
- All
- alone
- always
- analysis
- and
- ARE
- around
- AS
- At
- bars
- BE
- bearish
- before
- between
- Billion
- binance
- Binance Coin
- binance news
- Bitcoin
- Bitcoin News
- Bollinger bands
- Bound
- Break
- Bringing
- builds
- Bullish
- Bulls
- buy
- buy the dip
- buyers
- by
- CAN
- cap
- Chart
- clear
- Coin
- CoinMarketCap
- Coins
- considered
- continue
- continuing
- could
- crypto
- cryptocurrencies
- cryptocurrency
- Cryptocurrency Price
- Current
- Currently
- daily
- Days
- decisions
- Dip
- discussion
- driven
- driving
- entry
- ethereum
- Ethereum News
- expected
- experienced
- extensive
- external
- few
- financial
- flocking
- For
- For Investors
- from
- further
- future
- generally
- good
- Green
- healthy
- High
- highly
- HOURS
- HTTPS
- in
- Increase
- increased
- increasingly
- indicate
- Indicators
- interest
- internal
- Inu
- investment
- Investors
- IT
- ITS
- Keep
- largest
- Last
- latest
- Level
- levels
- like
- likely
- Line
- looking
- MACD
- maintain
- Majority
- Making
- manage
- Market
- Market Cap
- Market News
- market sentiment
- million
- Momentum
- more
- most
- movement
- movements
- Near
- nearly
- New
- news
- of
- on
- own
- past
- performance
- plato
- Plato Data Intelligence
- PlatoData
- Point
- positive
- potential
- price
- Price Analysis
- price chart
- Prices
- prospects
- Pushing
- reach
- recovery
- research
- Resistance
- Results
- reviewing
- Rise
- rsi
- sentiment
- sharp
- SHIB
- SHIB/USD
- Shiba
- Shiba Inu
- Shiba Inu News
- Shiba Inu Price
- shiba inu price analysis
- should
- sideways
- Signal
- significant
- Sitting
- Source
- spikes
- State
- strong
- Suggests
- support
- support level
- surge
- Surged
- Target
- Technical
- that
- The
- their
- to
- top
- traded
- Trading
- trading volume
- TradingView
- Trend
- Unexpected
- unpredictable
- Upside
- uptrend
- upward
- value
- volatile
- Volatility
- volume
- WELL
- What
- What is
- What is bitcoin
- whether
- which
- while
- will
- with
- worth
- Your
- zephyrnet


