- Solana leads altcoins into recovery after testing support at $150.
- Cosmos keeps the weekly run to new all-time highs intact while bulls look forward to juping above $40.
Most altcoins continued with last week’s dumping on Monday, accentuated by Bitcoin’s dip below $44,000. However, Solana and a few selected crypto assets stayed in the green, posting remarkable single-digit gains.
As the market wallowed in the red, investors took advantage to buy the dip, hence starting a fresh recovery during the Asian hours on Tuesday. Bitcoin has gained ground above $45,000, but as reported, its uptrend remains shaky toward $47,000.
Meanwhile, Solana is up an impressive 7% to trade at $167. Similarly, Cosmos is trading 11.8% higher, spotting a market price value of $36.46, according to CoinGecko. Other tokens performing relatively well are Avalanche, Quant, and Tezos.
Solana:-
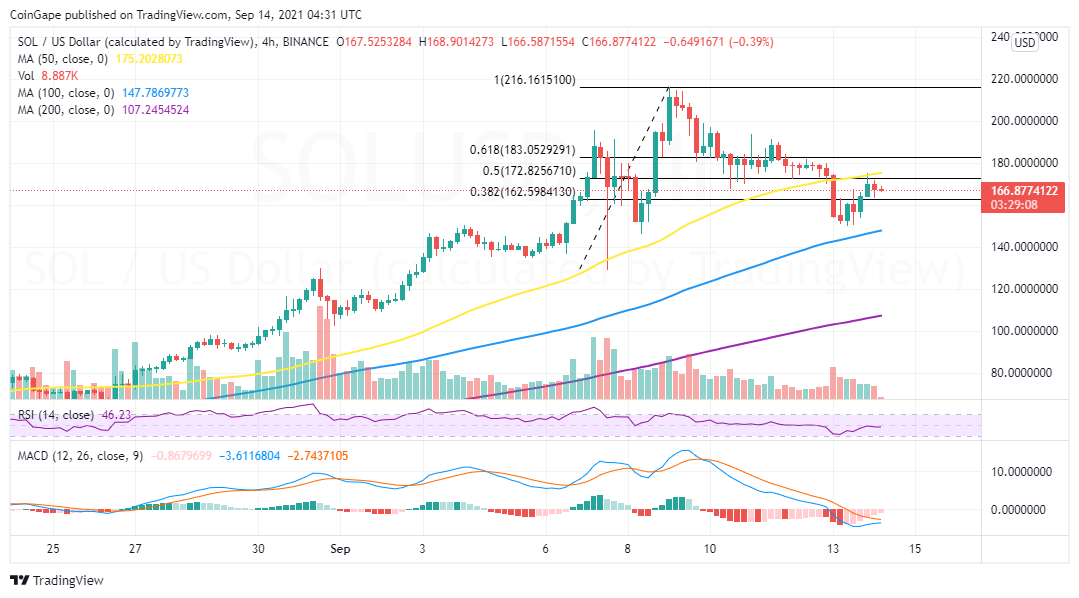
Solana recently secured support at $150, following a retracement from the all-time at $216. This smart contract token has been a bullish giant to watch, allowing investors to grow their investment faster and consistently.
Nonetheless, the market crash last least did not spare Solana, resulting in a gains-trimming event to $150.
Meanwhile, as expected, SOL appears to have resumed recovery this week with a bang, following from $150 to $172. At writing, Solana is teetering at $167, but the 50% Fibonacci level caps the immediate upside.
The Moving Average Convergence Divergence (MACD) will likely flip bullish in the coming sessions, especially when the 12-day EMA crosses above the 26-day EMA. Moreover, a four-hour close above the 50% Fibo and the 50 Simple Moving Average (SMA) may validate the uptrend to $180 and perhaps trigger gains past $200
On the flip side, Solana’s downside is protected at $162 by the 38.2% Fibonacci level. Holding above this level would allow bulls ample time to reenergize for the trajectory to $200. Moreover, the support will prevent Solana from revisiting $150.
SOL/USD Daily Chart

Cosmos:-
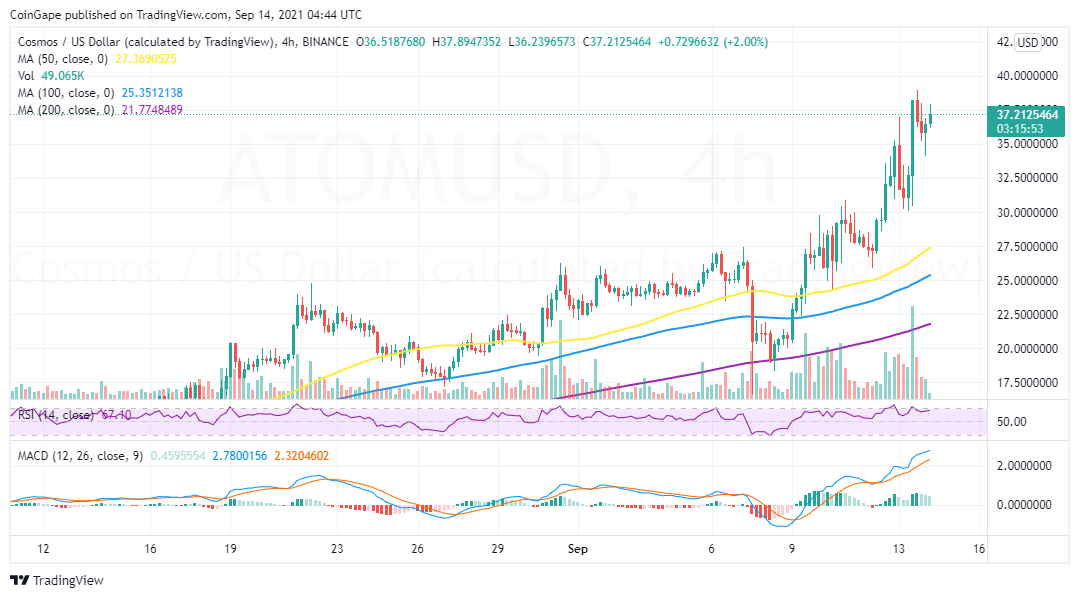
Cosmos has ignored the market crash and selling pressure to post consistent gains in the last week. Last week, ATOM only suffered a minor setback, incurring losses from $27.5 to areas around $17.5.
Nonetheless, a 102% rally followed the dip immediately, allowing Cosmos to trade a new all-time high at $38.95. Support at $35 has been confirmed, allowing bulls to regain control.
At writing, ATOM trades at $37.5 while buyers look forward to action above $40. The MACD is highly bullish, as observed on the four-chart. A four-hour close above $40 would spike gains bringing Cosmos closer to $50.
ATOM Four-Hour Chart

The RSI adds credence to the bullish outlook. Note that a return into the overbought region cements the bulls’ influence over the price.
Subscribe to our newsletter for free

Source: https://coingape.com/solana-cosmos-price-analysis-september-14-2021/
- "
- 000
- 11
- Action
- Ads
- ADvantage
- All
- Allowing
- Altcoins
- analysis
- around
- Assets
- atom
- Avalanche
- Bitcoin
- Bullish
- Bulls
- buy
- closer
- CoinGecko
- coming
- content
- contract
- Cosmos
- Crash
- crypto
- cryptocurrencies
- DID
- EMA
- Event
- financial
- Forward
- fresh
- Green
- Grow
- High
- hold
- HTTPS
- influence
- investing
- investment
- Investors
- Level
- Market
- market research
- Monday
- Newsletter
- Opinion
- Other
- Outlook
- pressure
- price
- Price Analysis
- rally
- recovery
- research
- Run
- selected
- Share
- Simple
- smart
- smart contract
- Solana
- support
- Testing
- Tezos
- time
- token
- Tokens
- trade
- trades
- Trading
- value
- Watch
- week
- weekly
- writing


