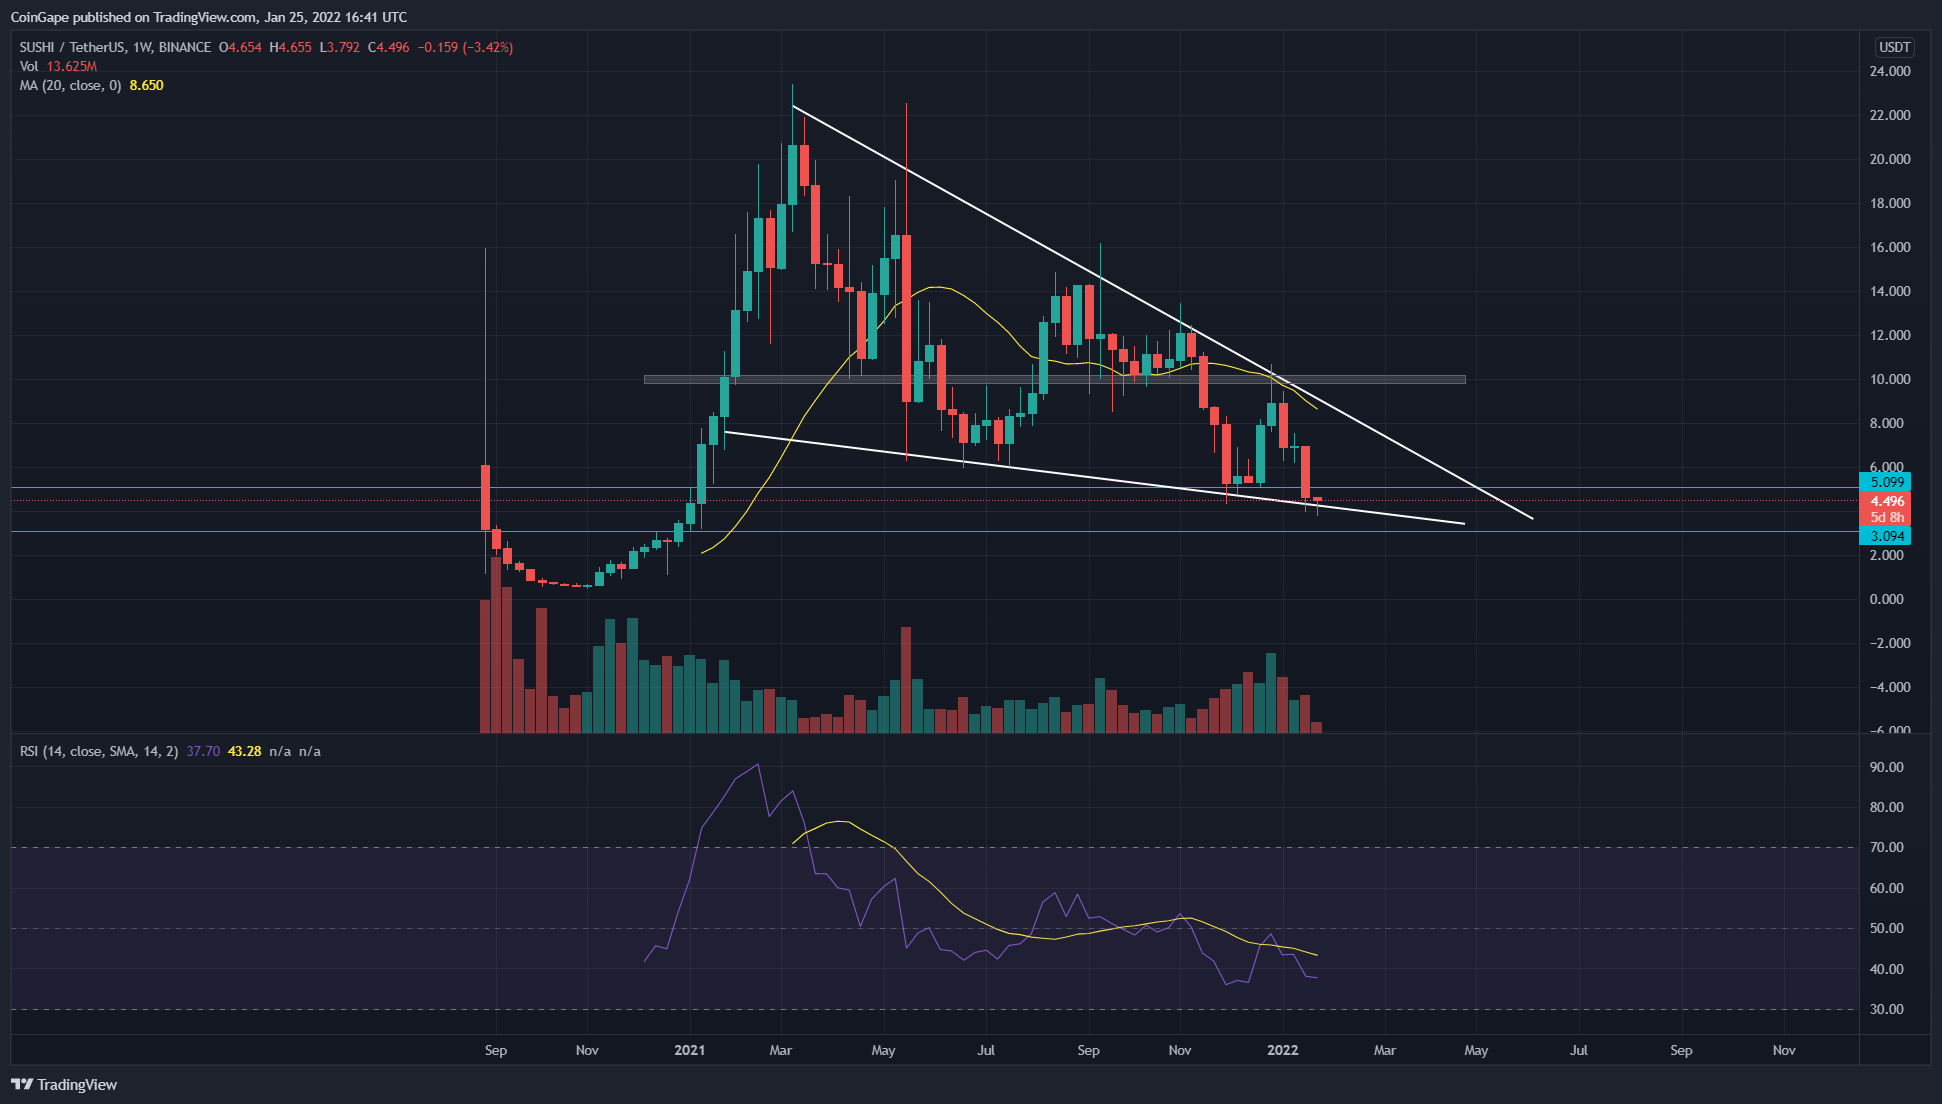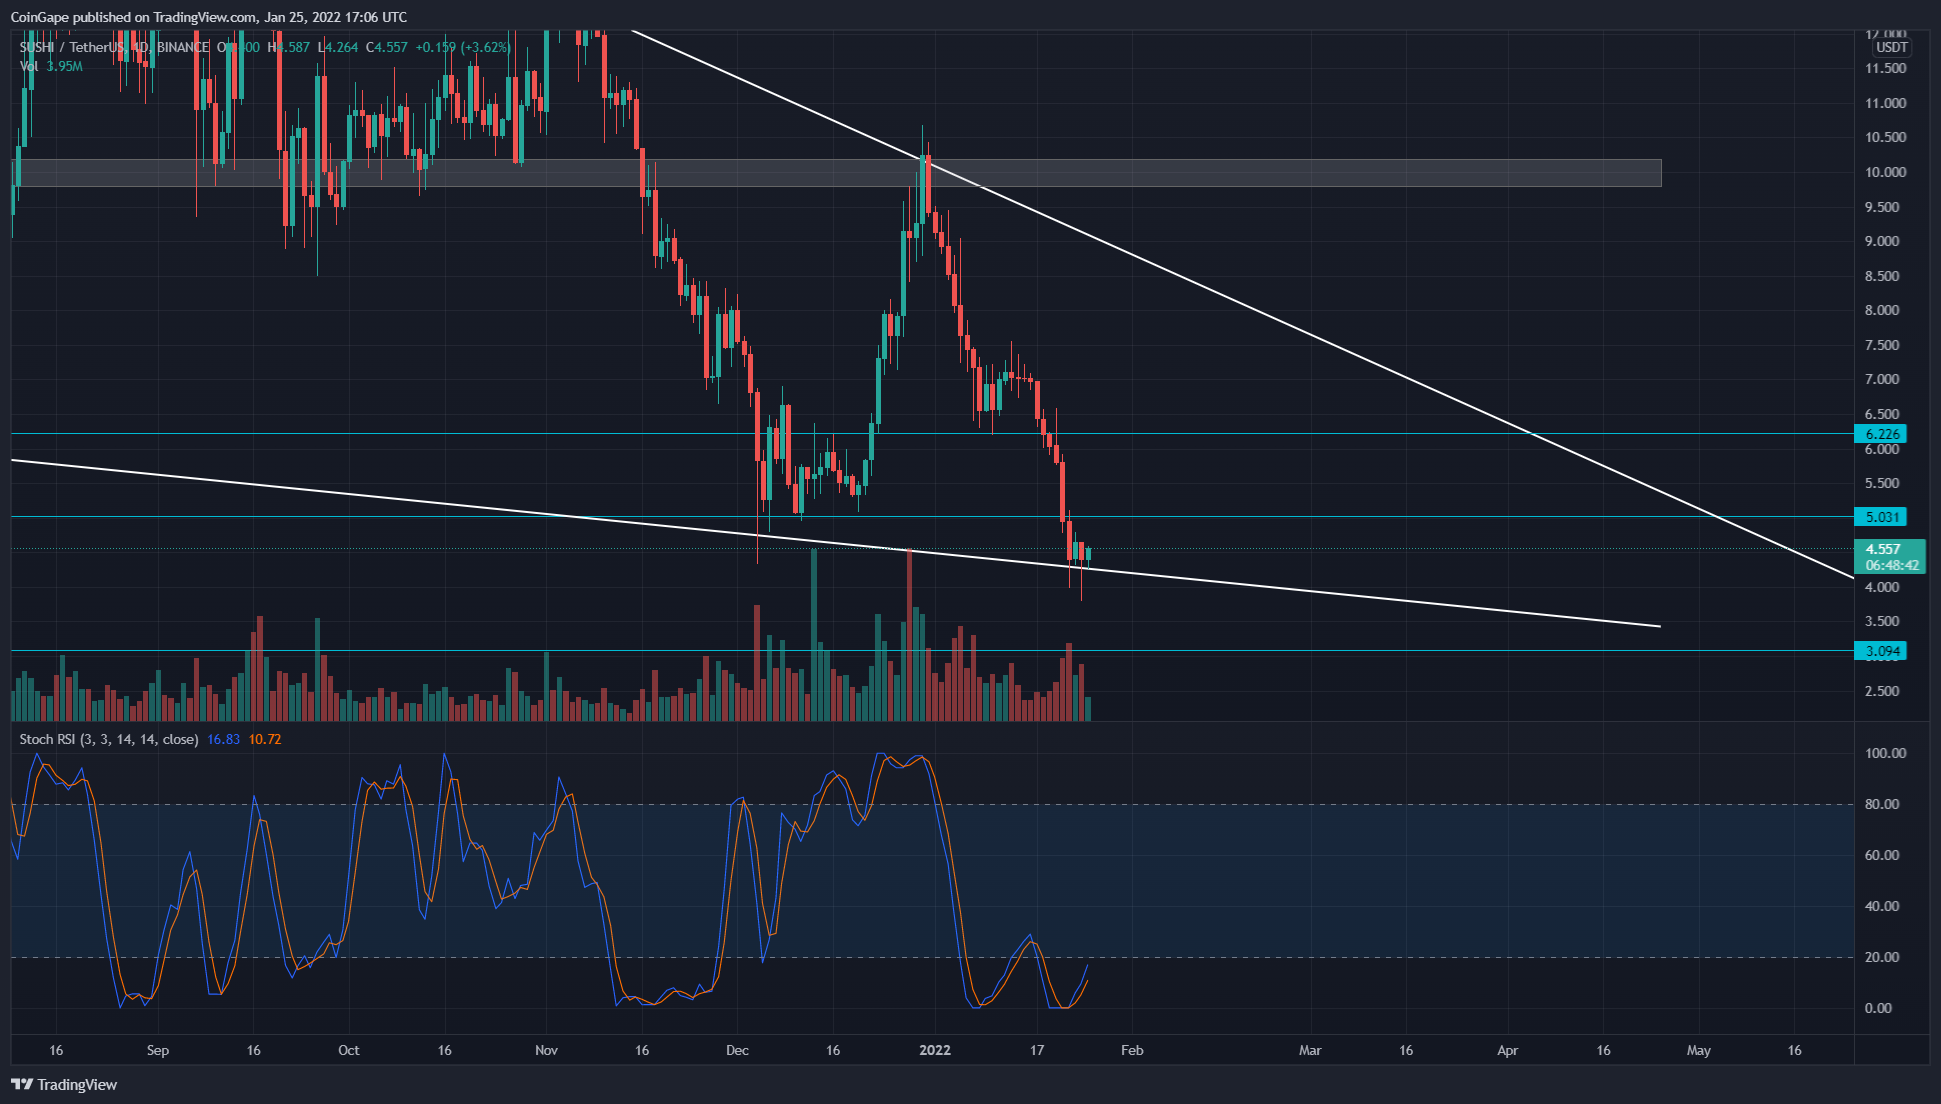
The SUSHI price chart displays the formation of flag patterns in the weekly time frame chart. The price action has been strictly following this pattern and has recently caused a 60% free-fall. The bulls will resume their buying by obtaining support from the falling trendline, indicating a reasonable possibility of bullish reversal.
Key technical points:
- The SUSHI price chart shows several lower price rejection candles at $4.5 support.
- The weekly-20 MA line provides strong resistance to SUSHI price
- The intraday trading volume in SUSHI/USD is $209.4 Million, indicating a 34.5% fall.
 Source- Tradingview
In our previous coverage of SUSHI technical analysis, the recovery rally in SUSHI price challenged a combined resistance of $9.8 and the resistance trendline of the flag pattern. The coin price experienced strong supply from these overhead resistances and was rejected with a weekly-evening star pattern.
- This renewed selling pressure plummeted the coin price to the support trendline($4.5), indicating a 50% devaluation.
- The crucial EMAs(20, 50, 100, and 200) indicate a bearish alignment in the daily time frame chart. Moreover, a negative crossover from the 20 and 50 EMA accelerates the ongoing selling.
- The weekly-Relative Strength index(34) slopes show a slight bullish divergence in the bearish territory.
Will SUSHI Bulls Reclaim The $5 Mark?
 Source-Tradingview
On January 21st, the SUSHI price nosedived below the $5 support. However, the coin buyers still defended the support trendline displaying multiple lower price rejection candles. The coin price could pull back to retest this flipped resistance($5); however, under the influence of the flag pattern price shows a high possibility to breach this resistance.
The Daily-Stochastic RSI provides a bullish crossover of the K and D line in the oversold region, indicating the price could start to rally.
- Resistance levels- $5, $6.2
- Support levels- $4 and $3
The post SUSHI Price Prediction: Flag Pattern Hints 50% Recovery In SUSHI Price appeared first on CoinGape.


