Executive Summary:
- Both Ethereum and Bitcoin markets are showing relative strength after a lengthy post-ATH consolidation, although prices have remained choppy and sideways since March.
- The SEC has surprised the market with the approval of the Ethereum Spot ETFs, resulting in a +20% rally in the ETH price.
- Bitcoin US Spot ETFs netflows have once again turned positive after four weeks of net outflows, suggesting a return of TradFi demand.
- Long-Term Holder spending pressure has cooled off significantly, with investors back to accumulation patterns, suggesting volatility is required to motivate the next wave.
A Coiling Spring
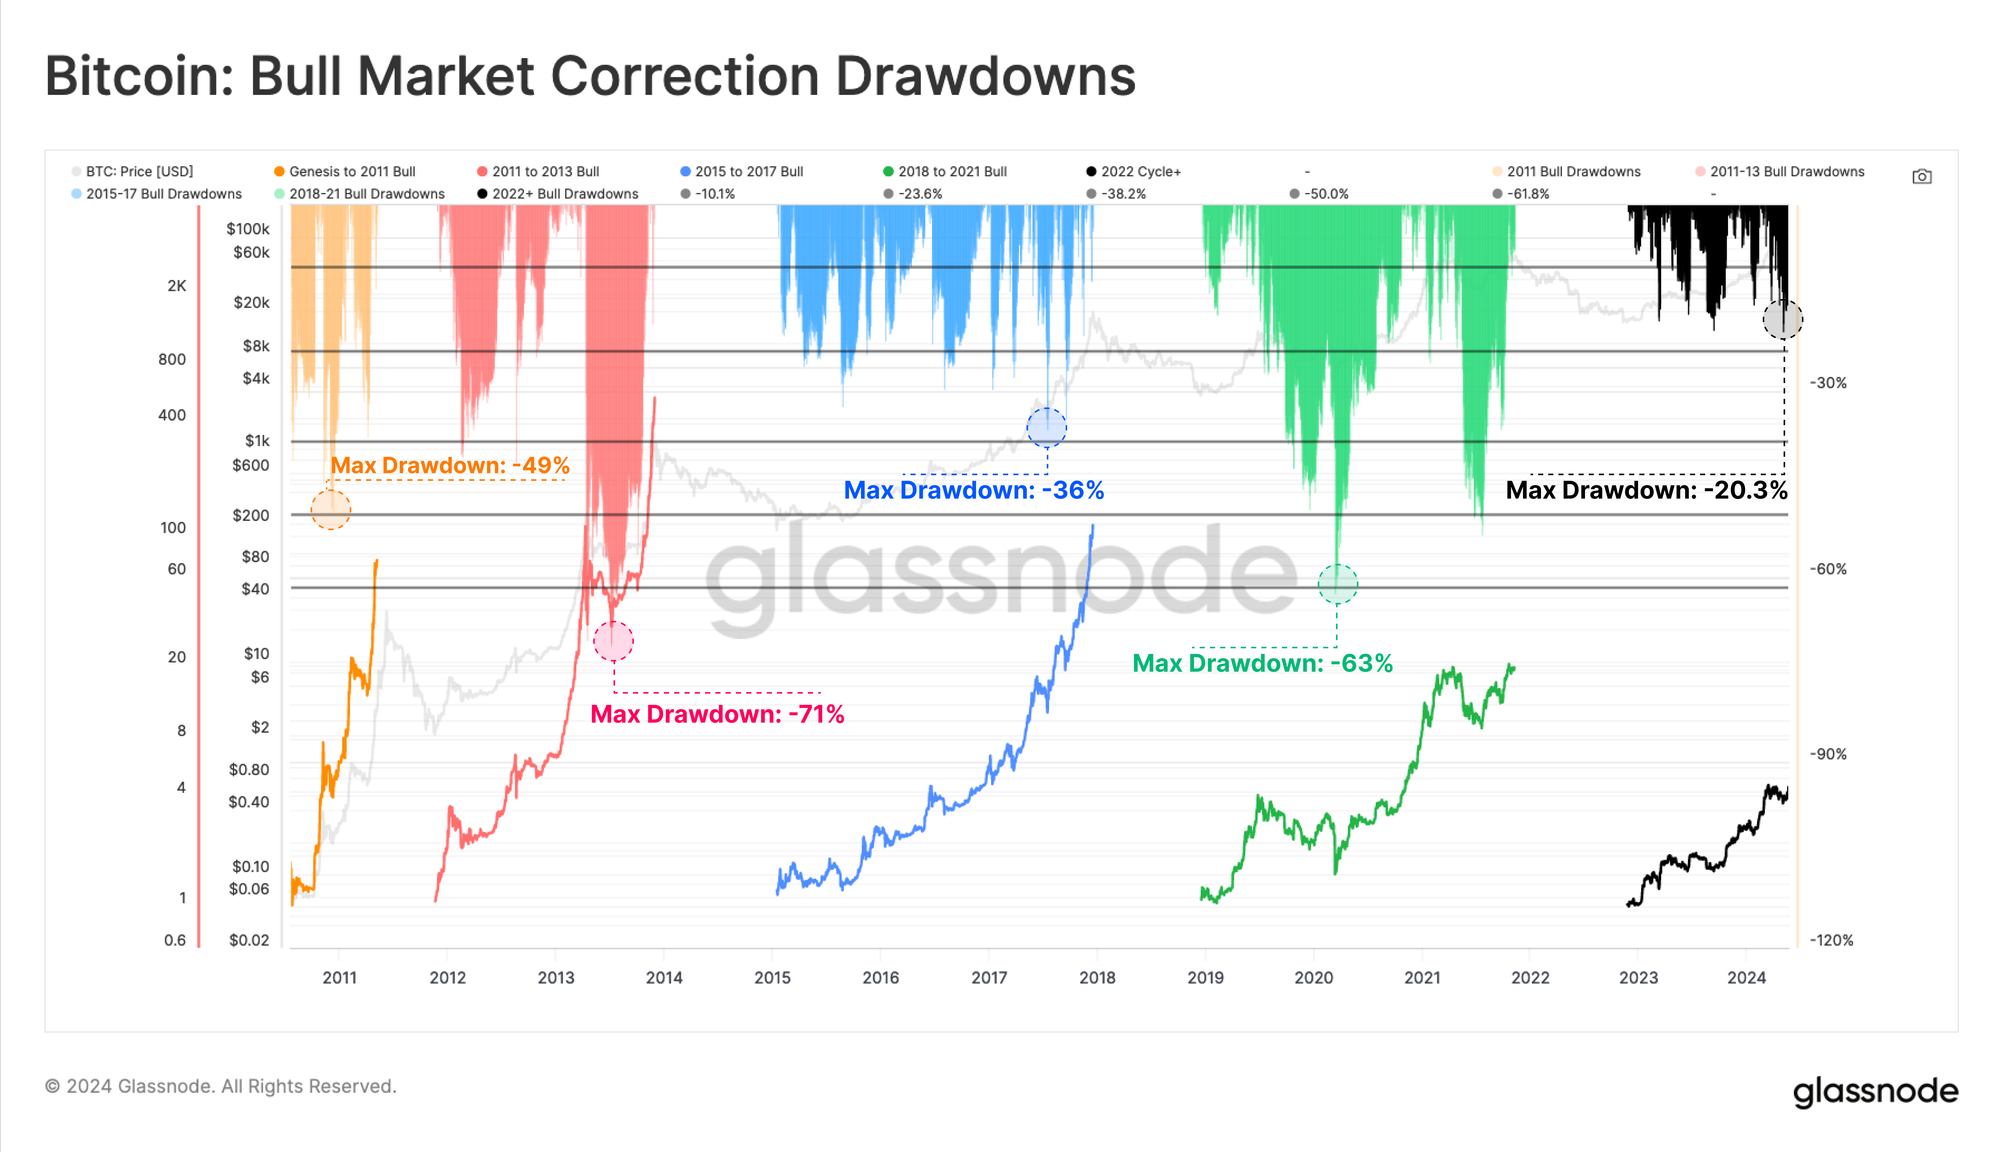
After recording the deepest correction on a closing basis since the FTX lows (-20.3%), Bitcoin has recovered back towards the ATH, reaching $71k on 20-May. From a comparative point of view, the drawdowns pattern across the 2023-24 uptrend appears to be remarkably similar to the 2015-17 bull market.
The 2015-17 uptrend occurred during Bitcoin’s infancy when no derivative instruments were available for the asset class. The parallel we can draw to the current market structure suggests that the 2023-24 uptrend may be a largely spot-driven market. This view is supported by the launch and inflows into the US Spot ETFs.
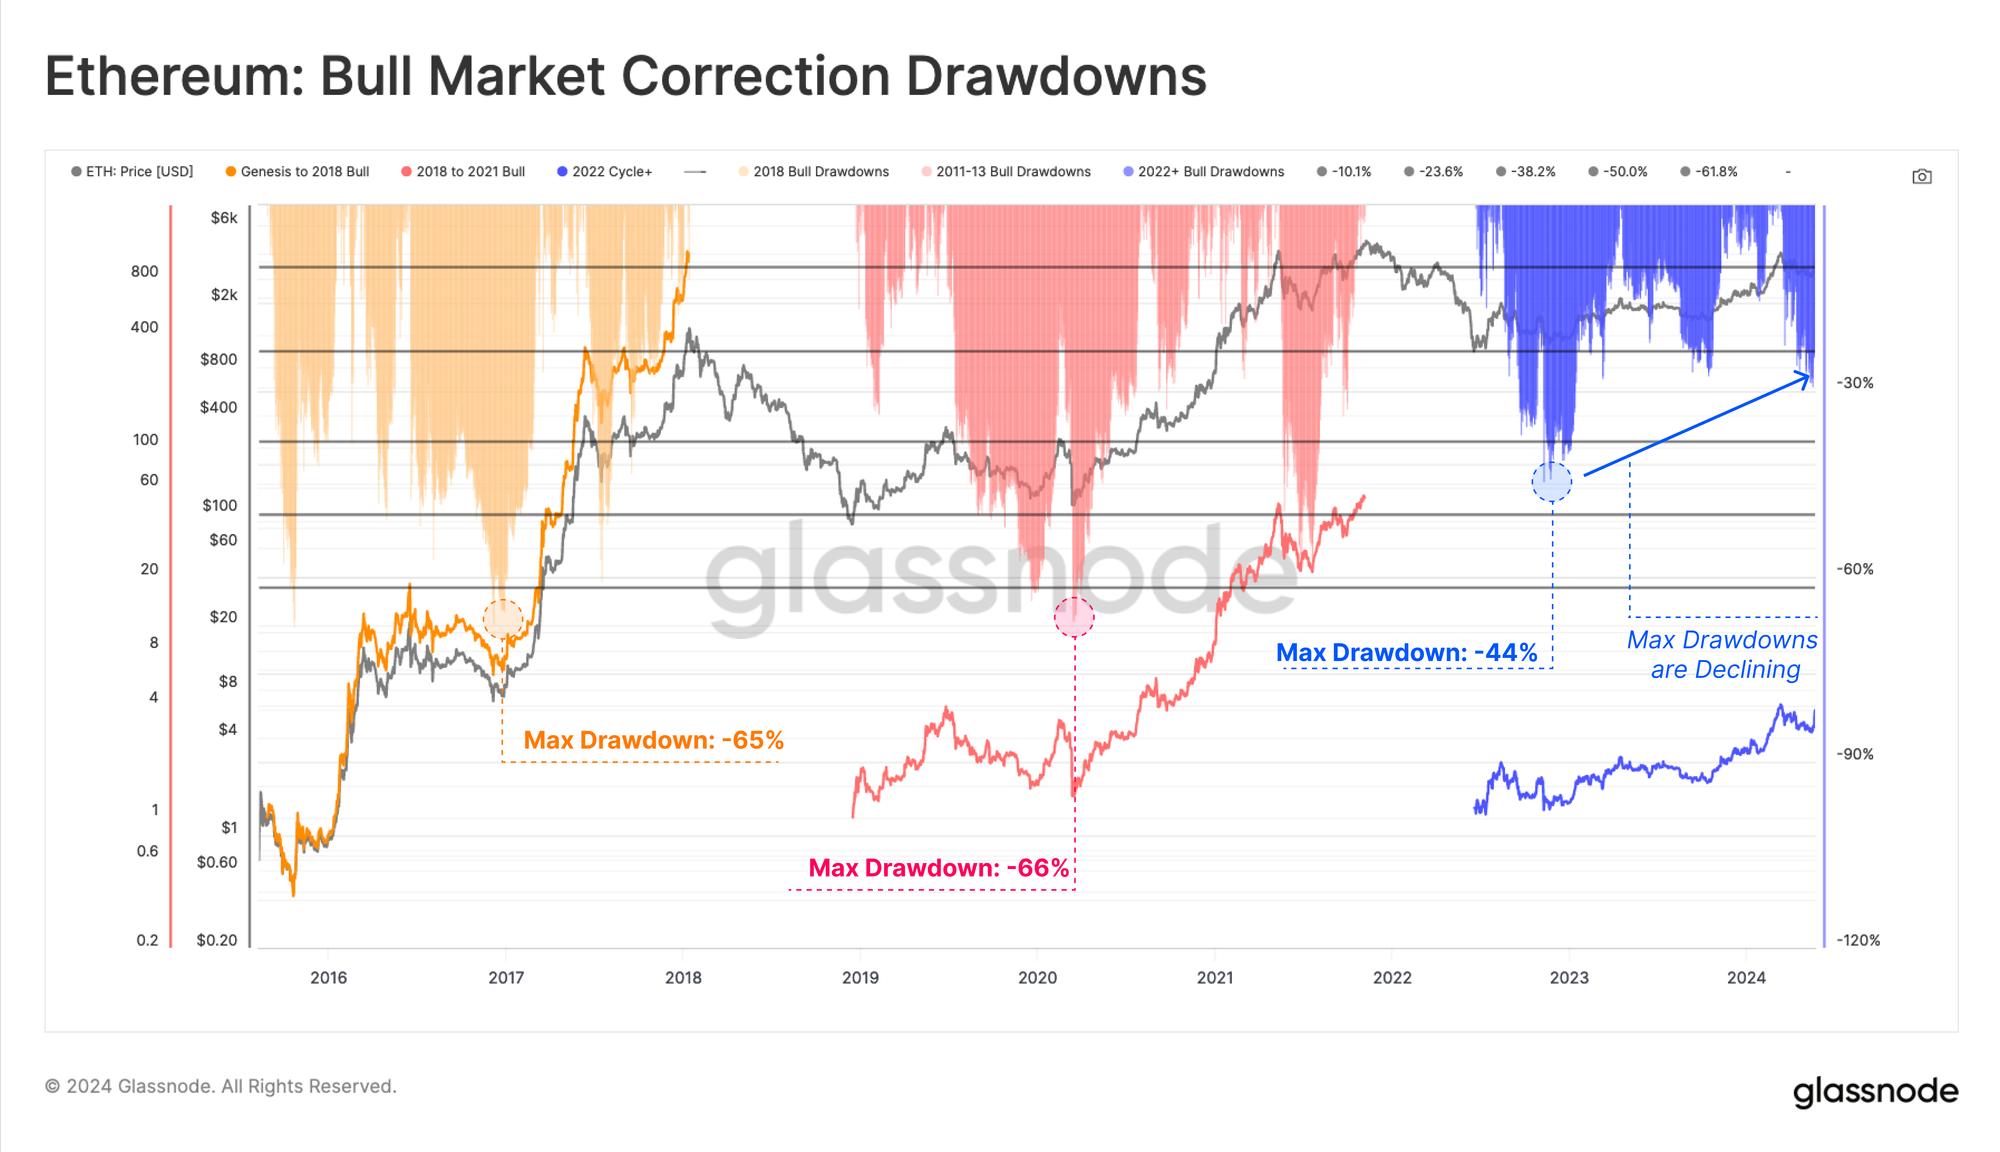
Ethereum has also seen notably shallower corrections since the FTX lows compared to prior cycles. This structure infers a degree of increasing market resilience is developing between each successive pullback, alongside a reduction in downside volatility.
However, it is worth highlighting that Ethereum has experienced a slower recovery relative to Bitcoin. ETH has also notably under-performed compared to other leading crypto assets over the last 2 years, manifesting in a weaker ETH/BTC ratio.
Nevertheless, the approval of US Spot ETFs this week came as a widely unexpected development and may provide the necessary catalyst to stimulate strength in the ETH/BTC ratio.
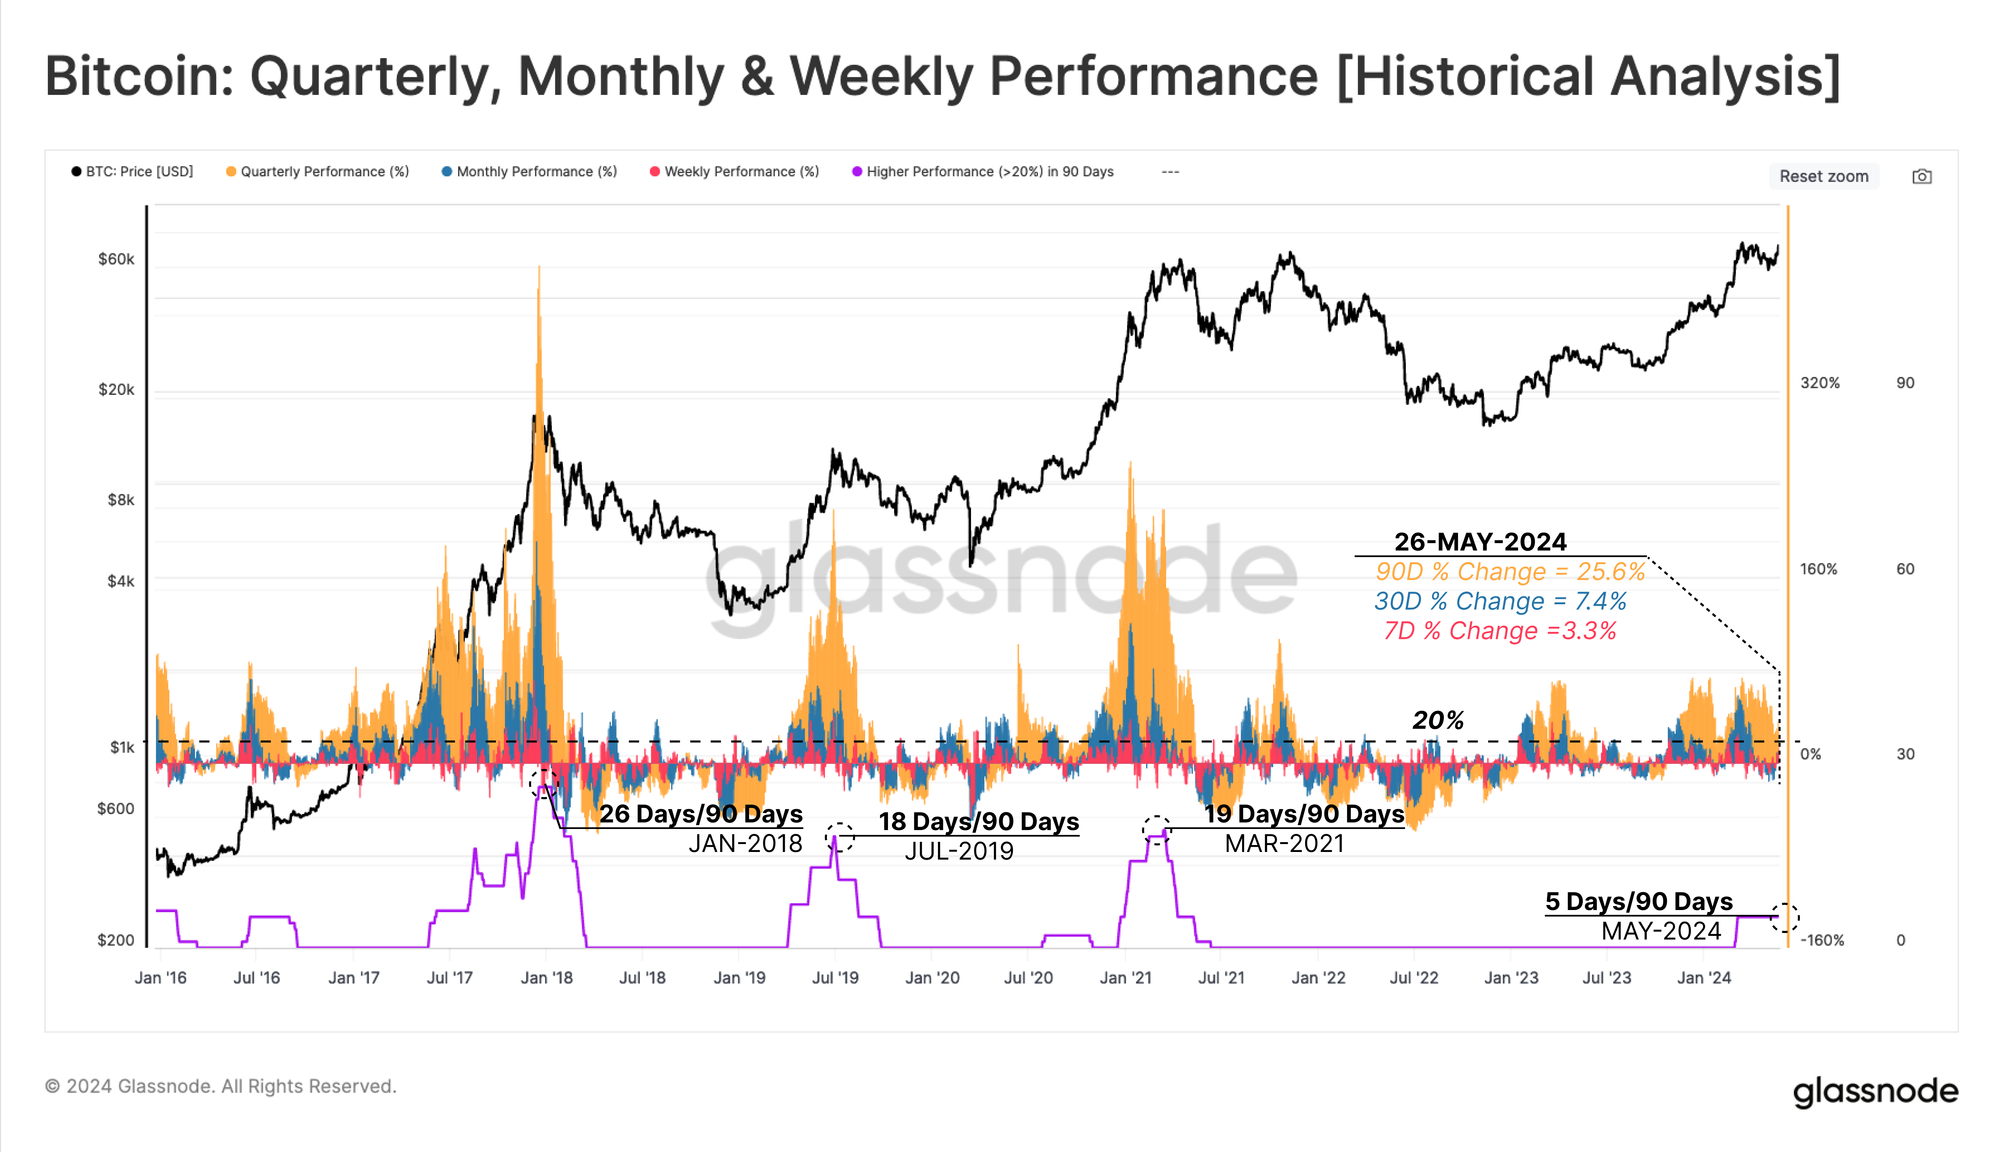
If we examine the rolling performance of the Bitcoin market across weekly 🟥, monthly 🟦 and quarterly 🟧 timeframes, we can see generally strong performance, recording values of +3.3%, +7.4%, and +25.6%, respectively.
To highlight periods of particularly strong price performance, we can count the number of trading days within a 90d window where performance across all three timeframes exceeds +20%. Only 5 days through the last quarter have reached this threshold so far.
In prior cycles, this count reached between 18 and 26-days, which suggests the current market may be somewhat more measured relative to historical bull markets.
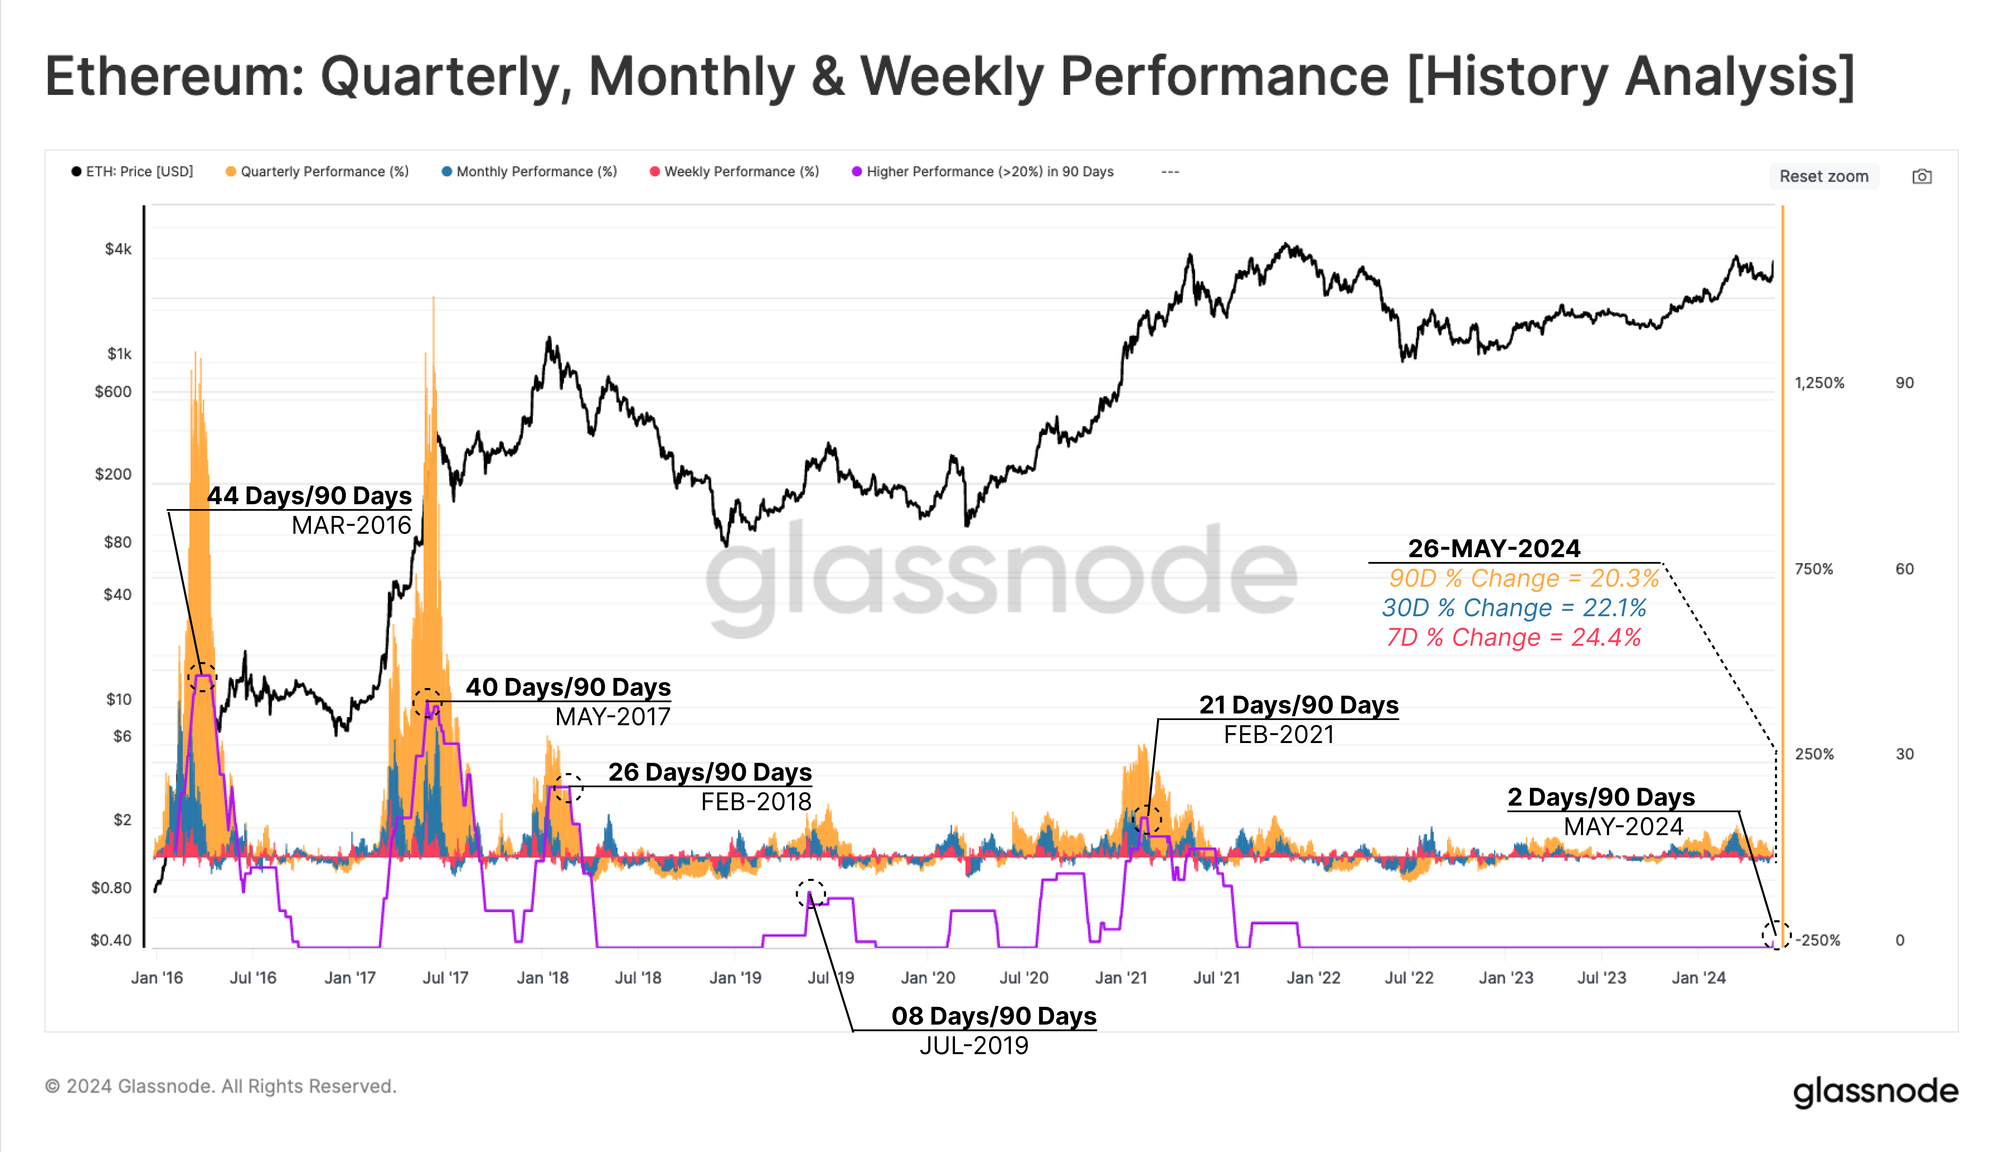
We can assess Ethereum under a similar framework and can see the dramatic impact of the ETF approvals. The news motivated almost instantaneous buy-side pressure, with all three timeframes printing their first >20% price movement since late 2021.
If we consider the sizeable impact and influence that spot ETFs have had on Bitcoin since the turn of the year, the ETH/BTC trading pair may be exhibiting early signs of a more promising road ahead.
ETF Buyer Comeback
The Bitcoin price decisively broke to a new ATH of $73k in early March, at the same time as long-term holders were divesting a significant volume of supply. This sell-side created an overhang of supply, leading to a period of correction and consolidation. Over time, lower prices and seller exhaustion started to give way to a regime of re-accumulation.
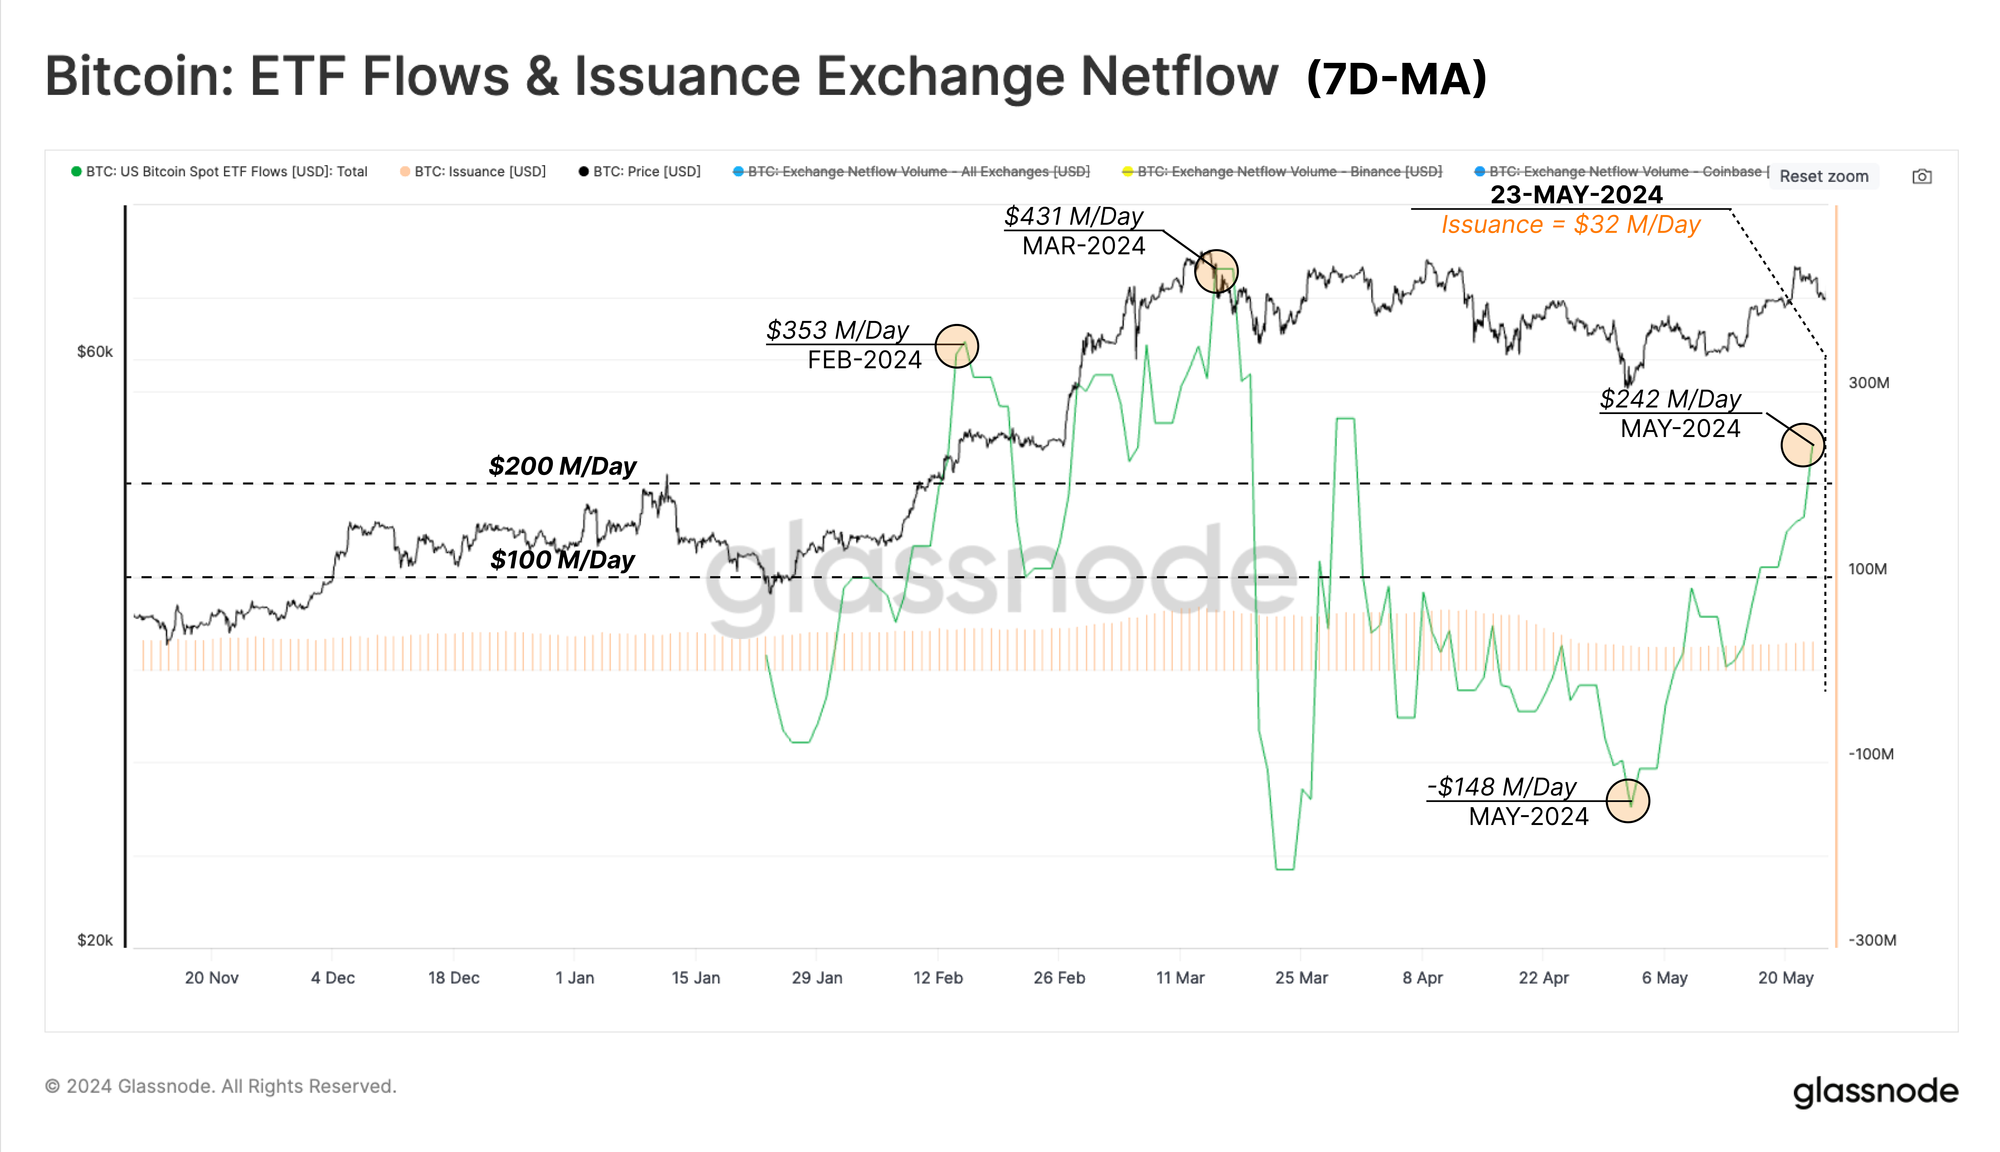
We can see this playing out in the Bitcoin ETF flows which transitioned into a regime of net outflows throughout the month of April. As the market sold off to the local low around $57.5k, the ETFs saw a large net outflow of -$148M/day. However, this turned out to be a form of micro-capitulation, and the trend has reversed sharply since.
Last week, the ETFs experienced a remarkable net inflow of $242M/day, suggesting a return back into buy-side demand. Considering the natural daily sell pressure by miners since the halving of $32M/Day, this ETFs buy pressure is almost 8 times larger. This highlights the size and scale of the ETF impact, but also the relatively small influence of the halving moving forwards.
Back to Euphoria
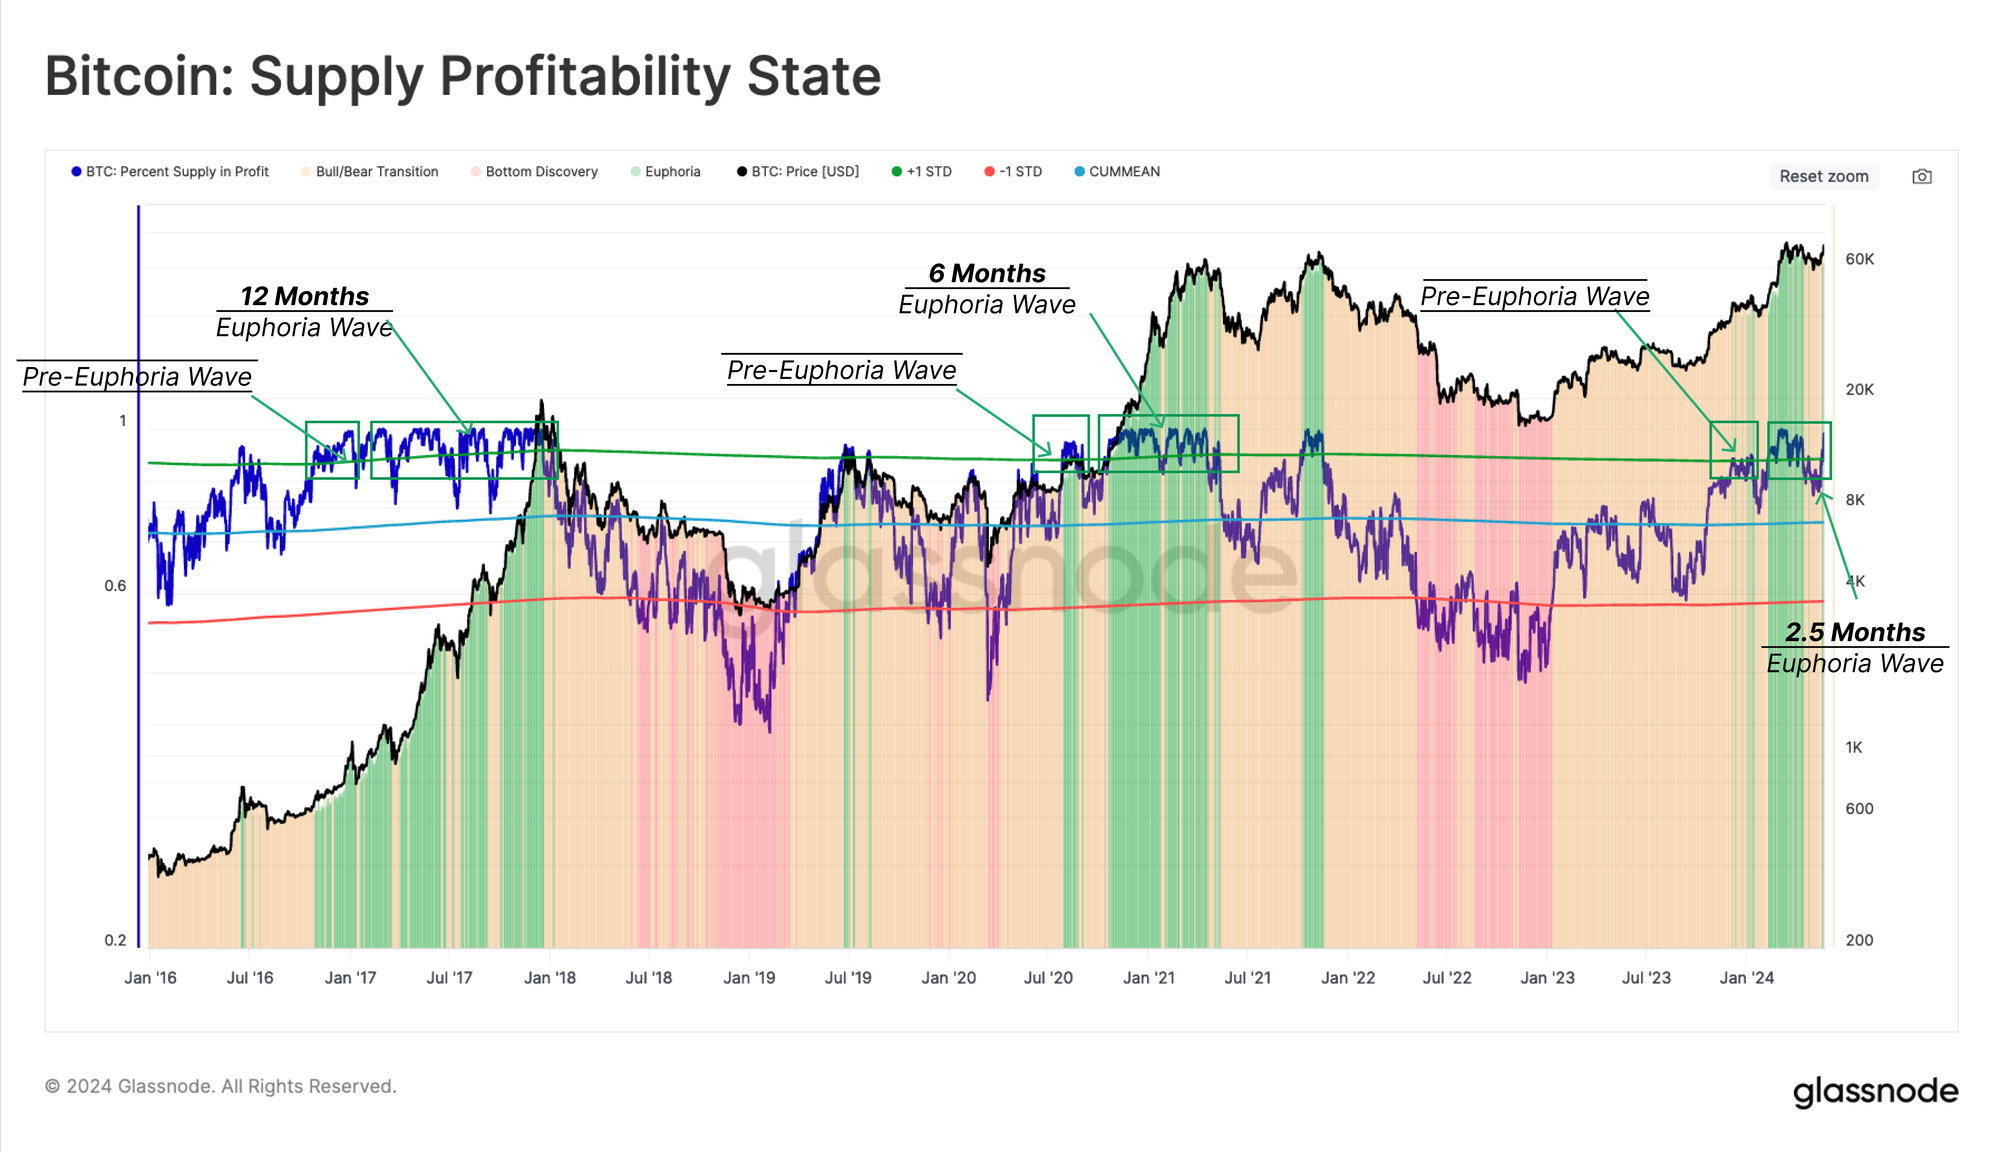
The percentage of the circulating supply in profit provides valuable information over each market cycle, and a set of repeating patterns has emerged. During the early stages of a bull market, as price attempts to reclaim the prior ATH, the percent of supply in profit breaks above its statistical threshold of ~90%. This signals the start of the Pre-Euphoria phase, and it historically entices investors to take profit from the table.
This sell-side pressure is usually attributed to long-term holders, who seize the opportunity to exit the market at elevated prices, especially after shouldering the downside volatility throughout the previous bear market.
As the market breaks towards a new ATH and price discovery, it enters the Euphoria phase, where the supply in profit starts to fluctuate around the 90% level for the next 6-12 months. The current euphoria phase is relatively young but has been active for around 2.5 months, with 93.4% of supply held in profit at the time of writing.
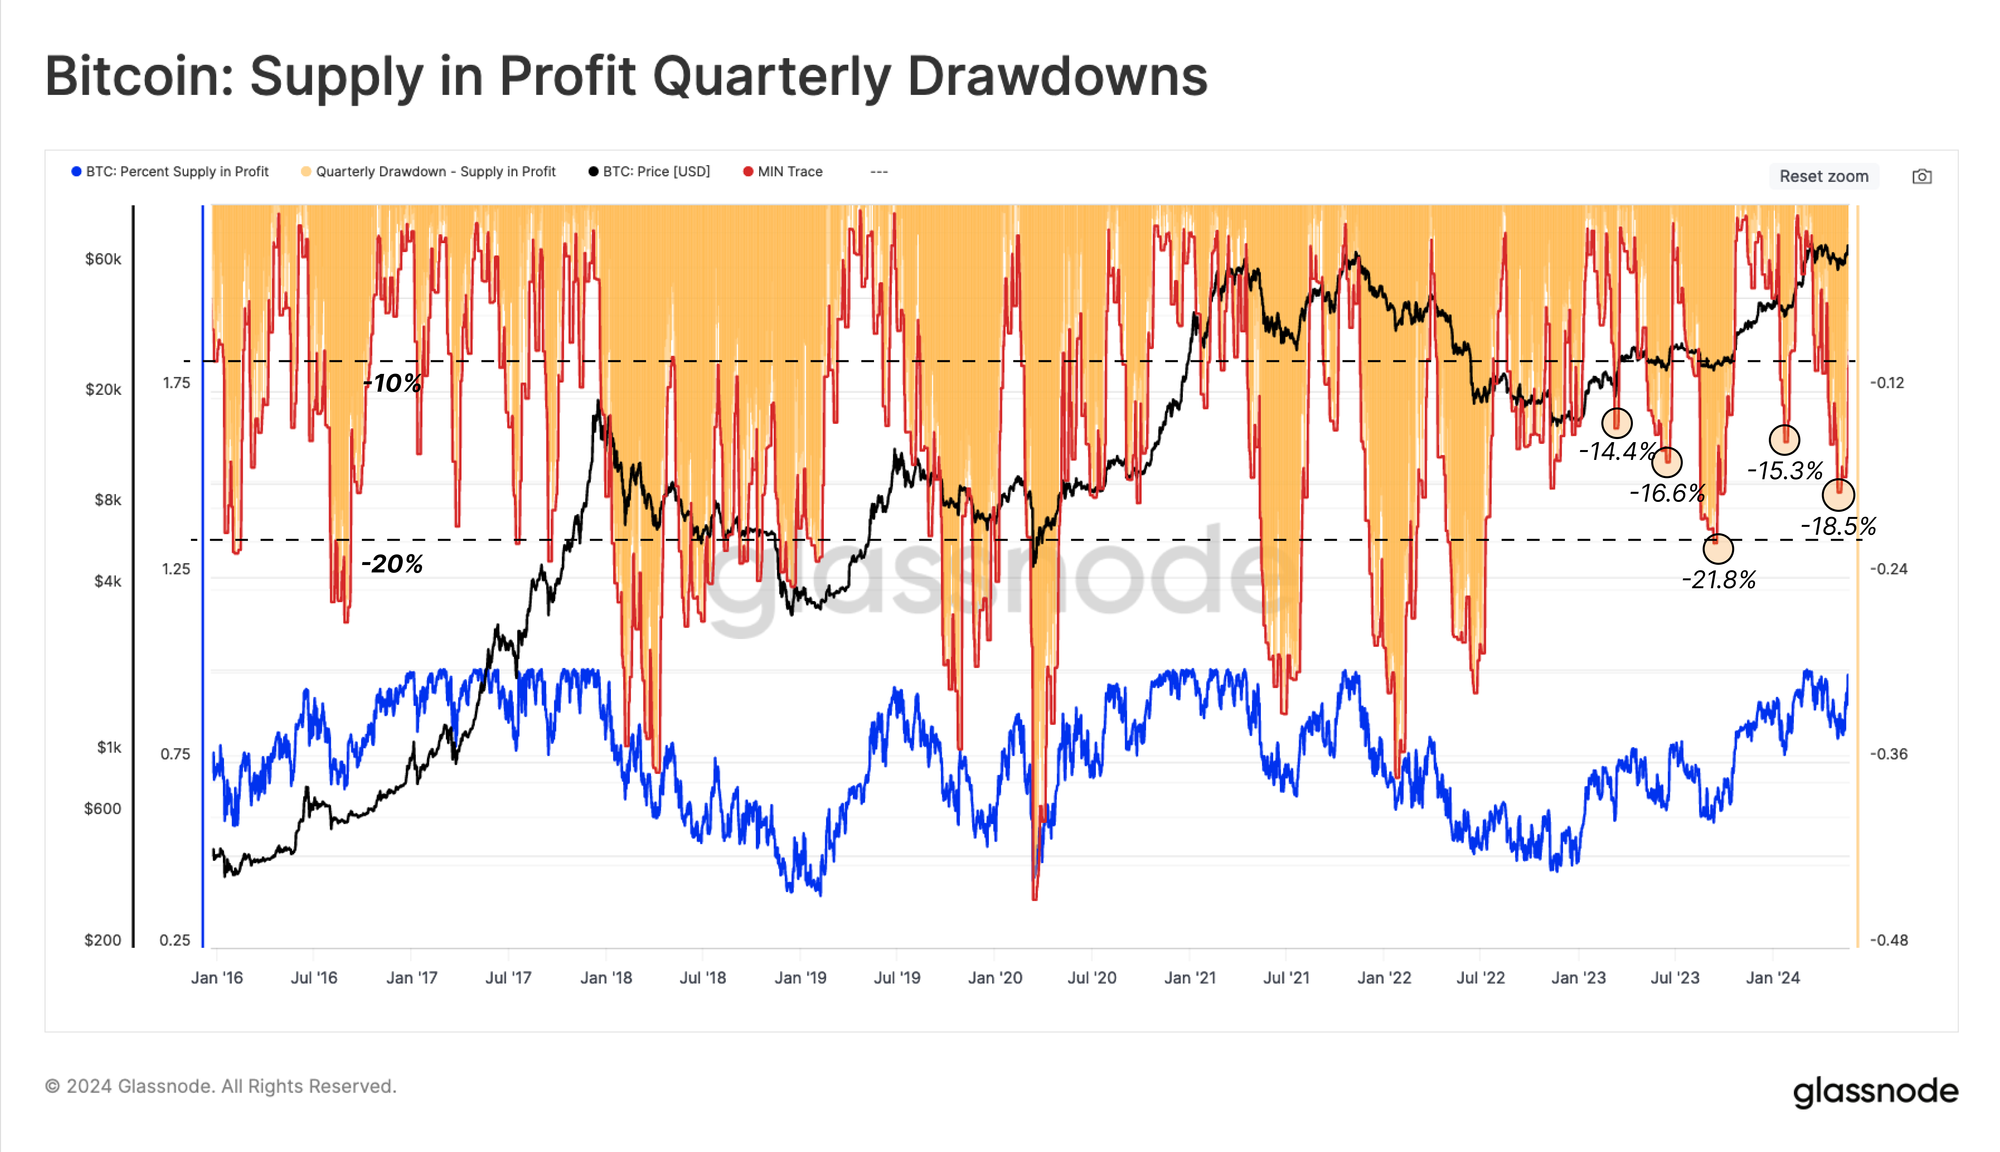
Another tool we can use to monitor corrections is the magnitude of unrealized losses held by investors. Given unrealised losses near ATHs represent ‘local top buyers’, we can evaluate the proportion of the supply which falls into loss 90d rolling window. This seeks to assess the percentage of coins which have lost their “in-profit” status compared to the local price peak.
Mechanically, these deep declines occur as new capital enters the network, absorbing sell-side pressure distributed during a local uptrend, which subsequently falls into loss during the following correction.
The depth of these drawdowns throughout the current uptrend is also comparatively similar to the 2015-2017 bull market, again suggesting a relatively robust market. This indicates that despite local peaks being set, they do not appear to have an excessive volume of coins bought at too high of a price.
Diamond Hands in Charge
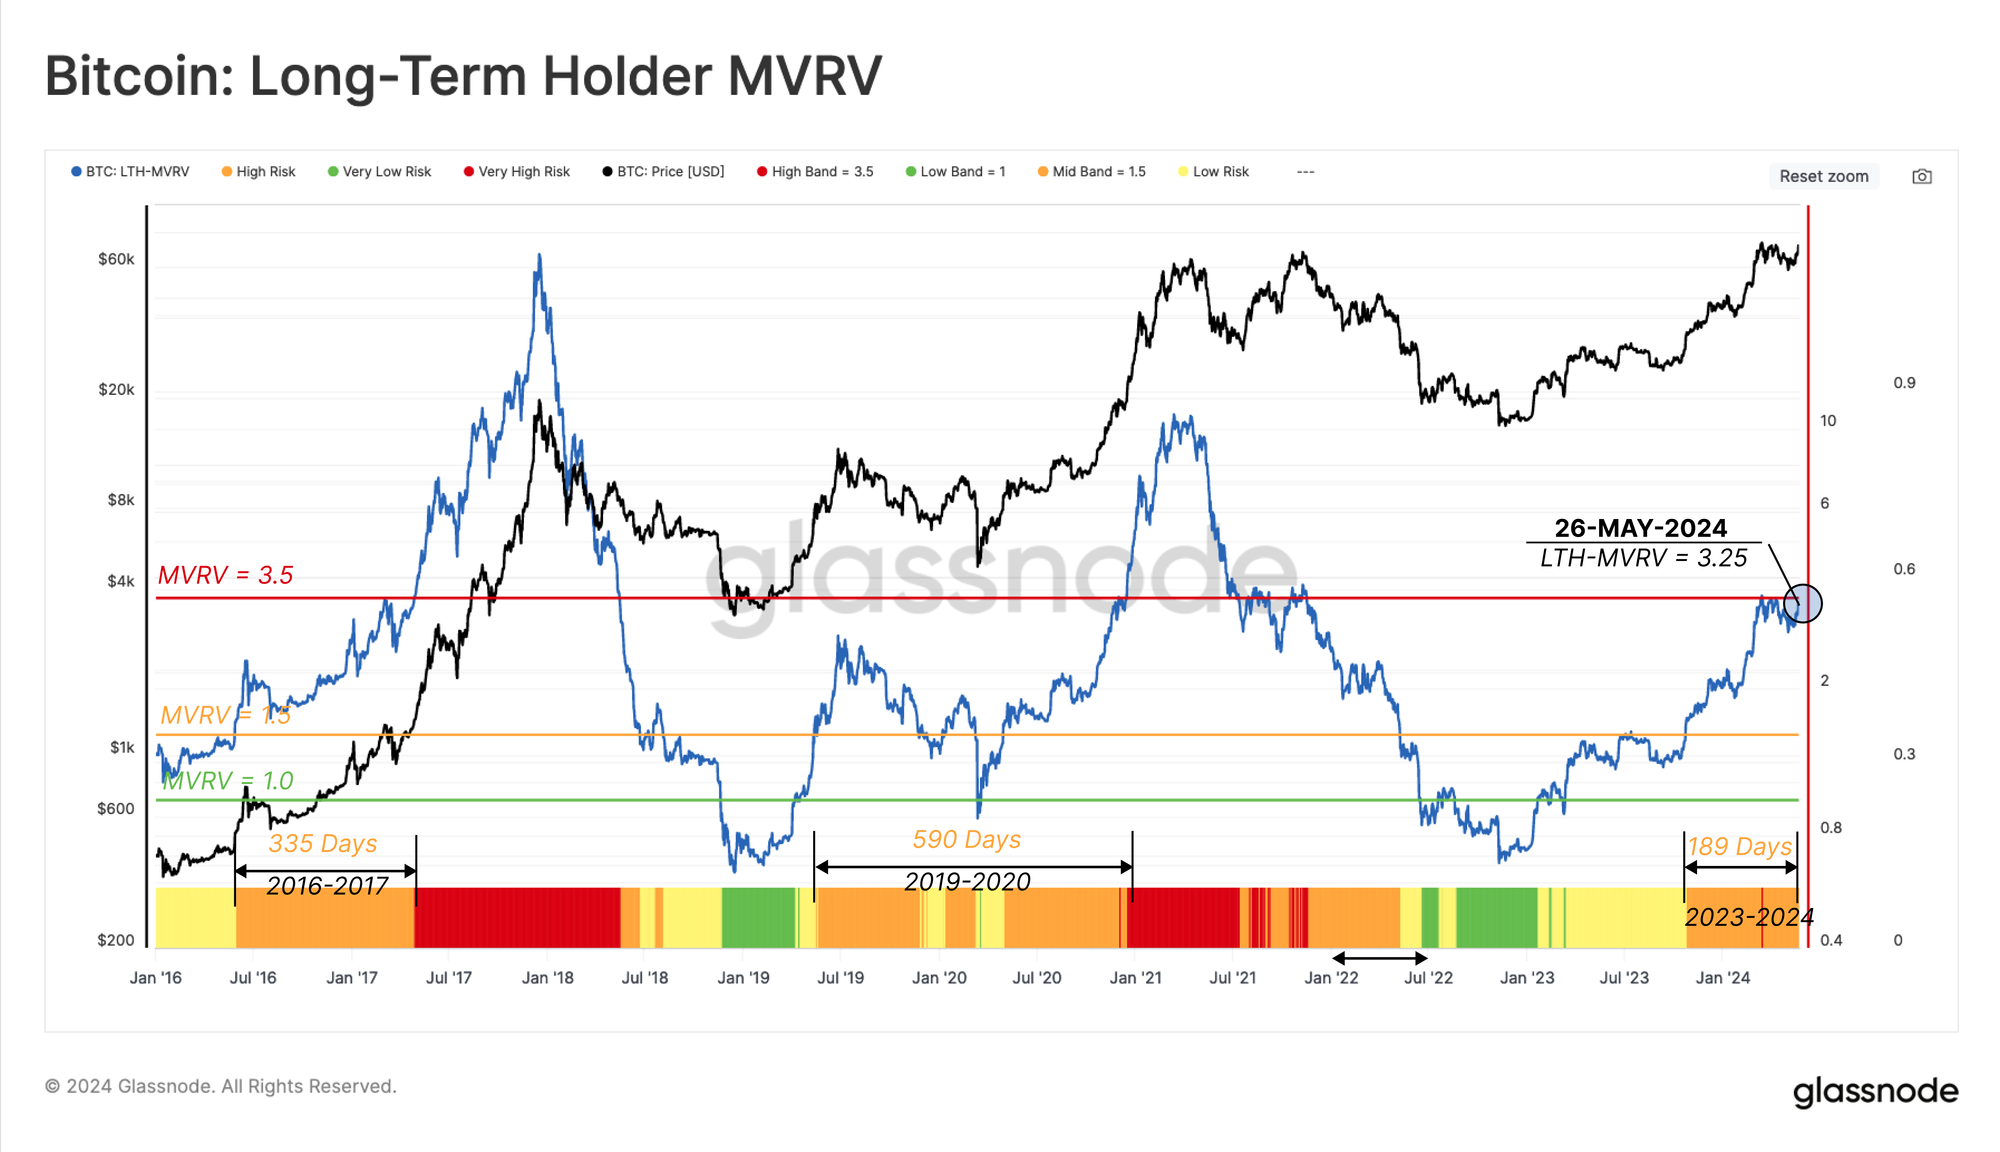
As prices appreciate in response to renewed buy-side pressure, the importance of the opposing side, the sell-side pressure, from Long-Term Holders grows in tandem. Therefore, we can evaluate the unrealized profit of the LTH cohort as a measure of their incentive to sell, and their realized profit to assess actual sell-side.
First, the MVRV Ratio for LTHs reflects their average unrealized profit multiple. Historically, the transition phase between a bear and a bull market sees LTH trade above 1.5, but below 3.5 🟧, and can last for one to two years.
If the market uptrend remains sustainable, forming new ATHs in the process, the unrealized profit held by LTHs will expand. This will substantially elevate their incentive to sell, and eventually leads to a degree of sell-side pressure that gradually exhausts the demand side.
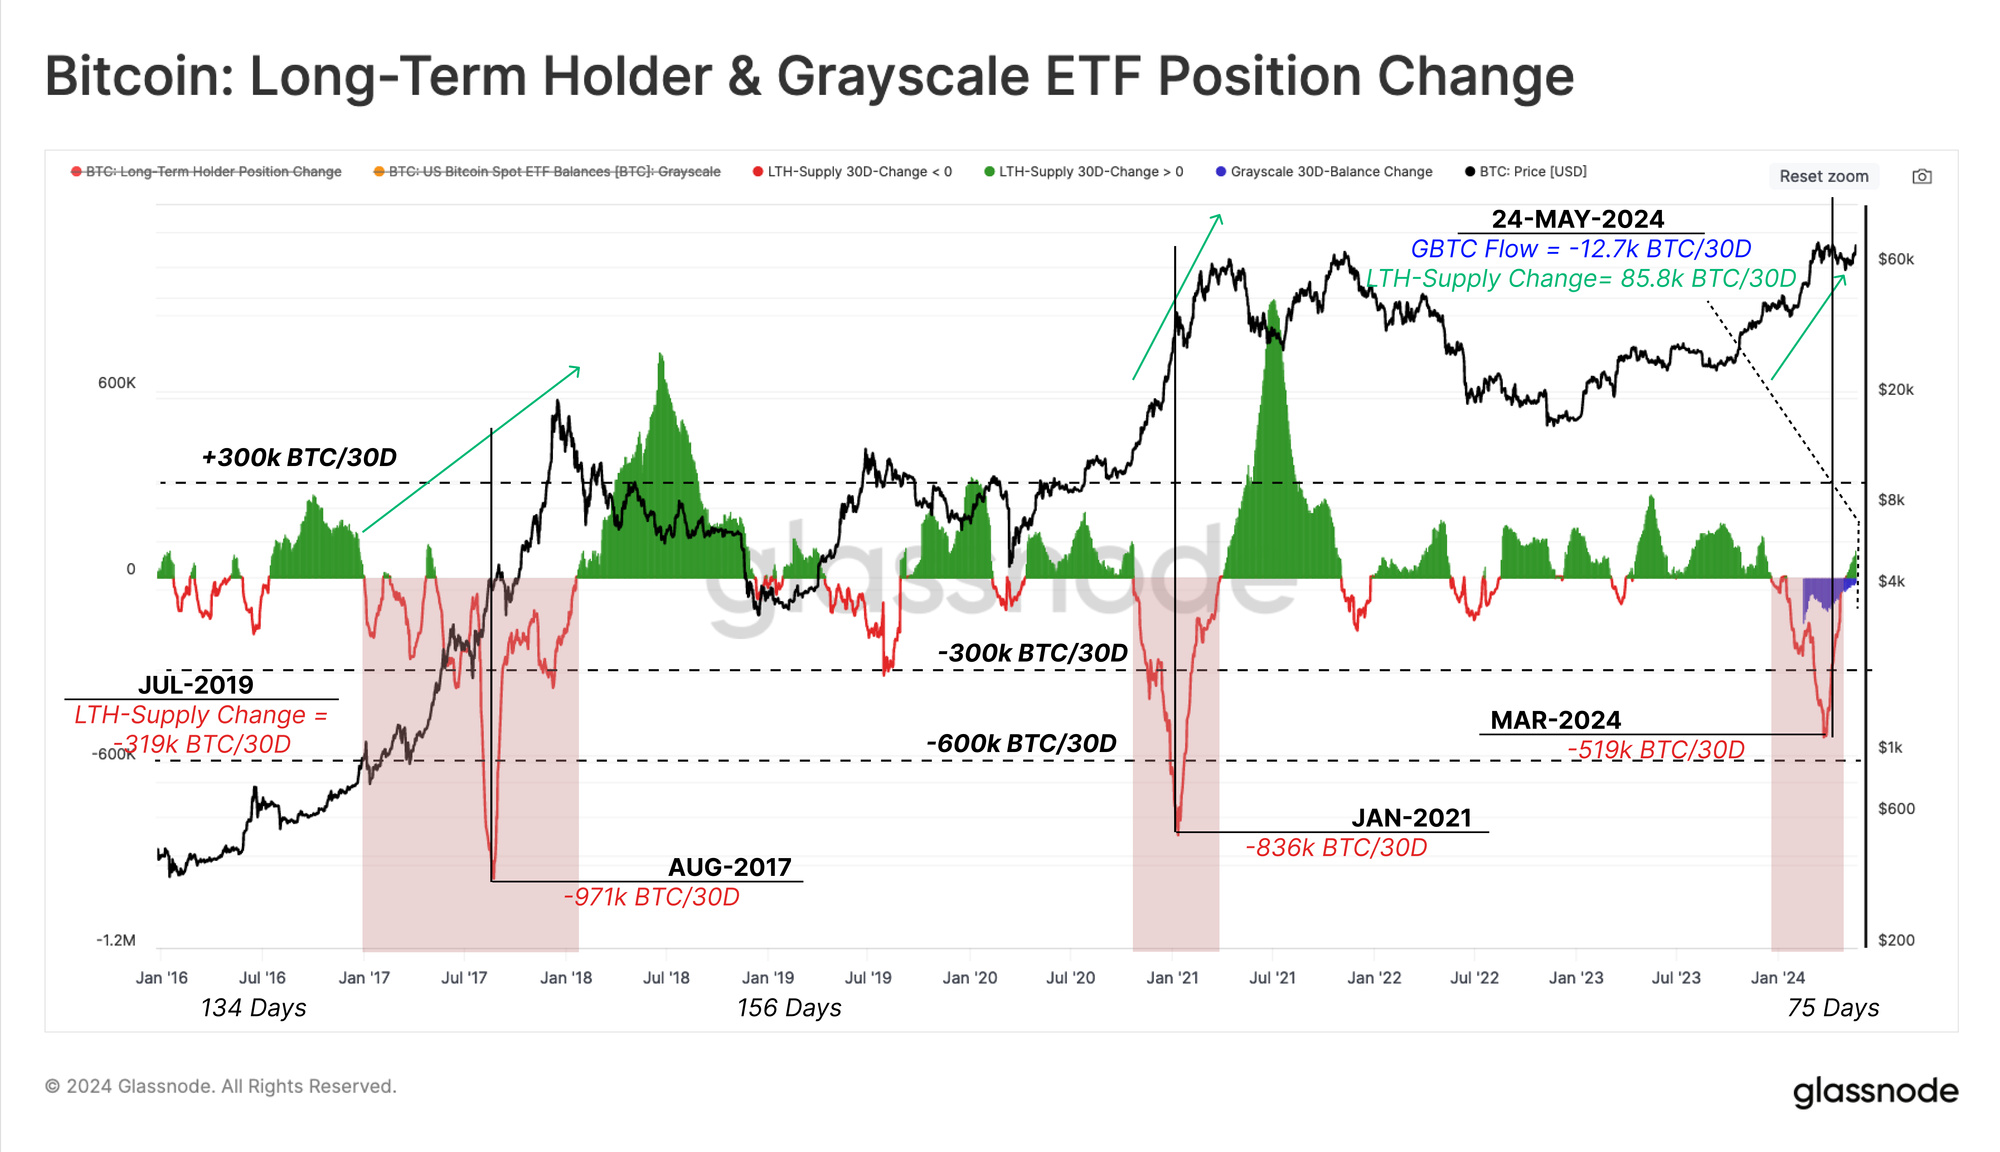
To close out this assessment, we will evaluate the spending rate of LTHs by via the 30-day net position change in their supply. During the run-up to the March ATH, the market experienced its first major tranche of LTH distribution.
During the last two bull markets, the LTH net distribution rate reached a substantial 836k to 971k BTC/month. At present, the net sell pressure peaked at 519k BTC/month in late March, with approximately 20% of this originating from Grayscale ETF holders.
This high-spending regime was followed by a cooling-off period, with a local regime of accumulation that saw aggregate LTH supply grow by around +12k BTC/Month.
Summary and Conclusions
In the wake of significant long-term holder investor distribution into the $73k ATH, sell-side pressure has noticeably contracted. The Long-Term Holders have since started to re-accumulate coins for the first time since December 2023. Alongside this, the spot Bitcoin ETFs have also seen a clear resurgence in demand, experiencing positive inflows, reflecting a substantial volume of buy-side pressure.
Furthermore, a levelling of the playing field between Bitcoin and Ethereum has occurred, with the approval of US Spot ETFs for Ethereum by the SEC. This further solidifies the ever-growing adoption of digital assets throughout the traditional financial system, and is a major step forward for the industry.
- SEO Powered Content & PR Distribution. Get Amplified Today.
- PlatoData.Network Vertical Generative Ai. Empower Yourself. Access Here.
- PlatoAiStream. Web3 Intelligence. Knowledge Amplified. Access Here.
- PlatoESG. Carbon, CleanTech, Energy, Environment, Solar, Waste Management. Access Here.
- PlatoHealth. Biotech and Clinical Trials Intelligence. Access Here.
- Source: https://insights.glassnode.com/the-week-onchain-week-22-2024/
- :has
- :is
- :not
- :where
- 1
- 2000
- 2021
- 2023
- 8
- a
- above
- accumulation
- across
- active
- actual
- Adoption
- advanced
- After
- again
- aggregate
- ahead
- All
- almost
- alongside
- also
- Although
- an
- and
- appear
- appears
- appreciate
- approval
- approvals
- approximately
- April
- ARE
- around
- AS
- assess
- assessment
- asset
- asset class
- Assets
- At
- ATH
- Attempts
- available
- average
- back
- basis
- BE
- Bear
- Bear Market
- been
- being
- below
- between
- Bitcoin
- bitcoin and ethereum
- Bitcoin ETF
- Bitcoin market
- Bitcoin Price
- bought
- breaks
- Broke
- bull
- Bull Market
- but
- buy
- Buy-Side
- BUYER..
- buyers
- by
- came
- CAN
- capital
- Catalyst
- change
- circulating
- class
- clear
- Close
- closing
- Cohort
- Coins
- comparatively
- compared
- Consider
- considering
- consolidation
- Corrections
- count
- created
- crypto
- crypto-assets
- Current
- cycle
- cycles
- daily
- Days
- December
- Declines
- deep
- deepest
- Degree
- Demand
- depth
- derivative
- Despite
- developing
- Development
- digital
- Digital Assets
- discovery
- distributed
- distribution
- do
- downside
- dramatic
- draw
- during
- each
- Early
- ELEVATE
- elevated
- emerged
- Enters
- especially
- ETF
- ETFs
- ETH
- eth price
- ethereum
- evaluate
- eventually
- ever-growing
- examine
- exceeds
- excessive
- Exhibiting
- Exit
- Expand
- experienced
- experiencing
- Falls
- far
- field
- financial
- financial system
- First
- first time
- Flows
- fluctuate
- followed
- following
- For
- form
- Forward
- four
- Framework
- from
- FTX
- further
- generally
- Give
- given
- Glassnode
- gradually
- Grayscale
- Grow
- Grows
- had
- Halving
- Hands
- Have
- Held
- High
- Highlight
- highlighting
- highlights
- historical
- historically
- holder
- holders
- However
- HTTPS
- Impact
- importance
- in
- Incentive
- increasing
- indicates
- industry
- inflows
- influence
- information
- instruments
- into
- investor
- Investors
- IT
- ITS
- large
- largely
- larger
- Last
- Late
- launch
- leading
- Leads
- lengthy
- Level
- local
- long-term
- Long-term Holder
- long-term holders
- loss
- losses
- lost
- Low
- lower
- Lows
- major
- March
- Market
- Market Cycle
- Market Structure
- Markets
- May..
- measure
- Miners
- Monitor
- Month
- monthly
- months
- more
- motivate
- motivated
- movement
- moving
- multiple
- MVRV
- MVRV ratio
- Natural
- Near
- necessary
- net
- network
- New
- news
- next
- no
- notably
- noticeably
- number
- occur
- occurred
- of
- off
- on
- once
- ONE
- only
- Opportunity
- originating
- Other
- out
- outflows
- over
- pair
- Parallel
- particularly
- Pattern
- patterns
- Peak
- percent
- percentage
- performance
- period
- periods
- phase
- plato
- Plato Data Intelligence
- PlatoData
- playing
- Point
- Point of View
- position
- positive
- present
- pressure
- previous
- price
- Prices
- printing
- Prior
- process
- professional
- Profit
- promising
- proportion
- provide
- provides
- pullback
- Quarter
- quarterly
- rally
- Rate
- ratio
- reached
- reaching
- realized
- recording
- recovery
- reduction
- reflecting
- reflects
- regime
- relative
- relatively
- remained
- remains
- remarkable
- renewed
- represent
- required
- resilience
- respectively
- response
- resulting
- return
- road
- robust
- Rolling
- same
- saw
- Scale
- SEC
- see
- Seeks
- seen
- sees
- Seize
- sell
- set
- shouldering
- showing
- side
- sideways
- signals
- significant
- significantly
- Signs
- similar
- since
- Size
- small
- So
- so Far
- sold
- solidifies
- somewhat
- Spending
- Spot
- stages
- start
- started
- starts
- statistical
- Status
- Step
- stimulate
- strength
- strong
- structure
- Subsequently
- substantial
- substantially
- Suggests
- SUMMARY
- supply
- supply in profit
- Supported
- surprised
- sustainable
- system
- table
- Take
- Tandem
- that
- The
- their
- therefore
- These
- they
- this
- this week
- three
- threshold
- Through
- throughout
- time
- times
- to
- too
- tool
- top
- towards
- trade
- TradFi
- Trading
- traditional
- tranche
- transition
- transitioned
- Trend
- TURN
- Turned
- two
- under
- Unexpected
- unrealized losses
- uptrend
- us
- use
- usually
- Valuable
- Values
- via
- View
- Volatility
- volume
- Wake
- was
- Wave
- Way..
- we
- weaker
- week
- weekly
- Weeks
- were
- when
- which
- WHO
- widely
- will
- window
- with
- within
- worth
- writing
- year
- years
- young
- zephyrnet


