UMA is under pressure with support at $11. If bulls flow back, UMA/USDT could recover towards $20. On the reverse side, Bancor prices are within a $2 range zone as bulls target $9.
Bancor (BNT)
The Bancor protocol is the first to facilitate trustless swapping of tokens. Their core objective is to improve liquidity for altcoins while rewarding liquidity providers. BNT is the dApps governance token.
Past Performance of BNT
Year-to-date, BNT gains are parabolic. After such a stretch, prices are cooling off as market forces aim to strike an equilibrium.
As of writing, the token is up 29 percent against the USD on the last trading week.
However, participation has tapered. The average trading volumes for BNT are down 25 percent to around $68 million on the last trading day.
Day-Ahead and What to Expect
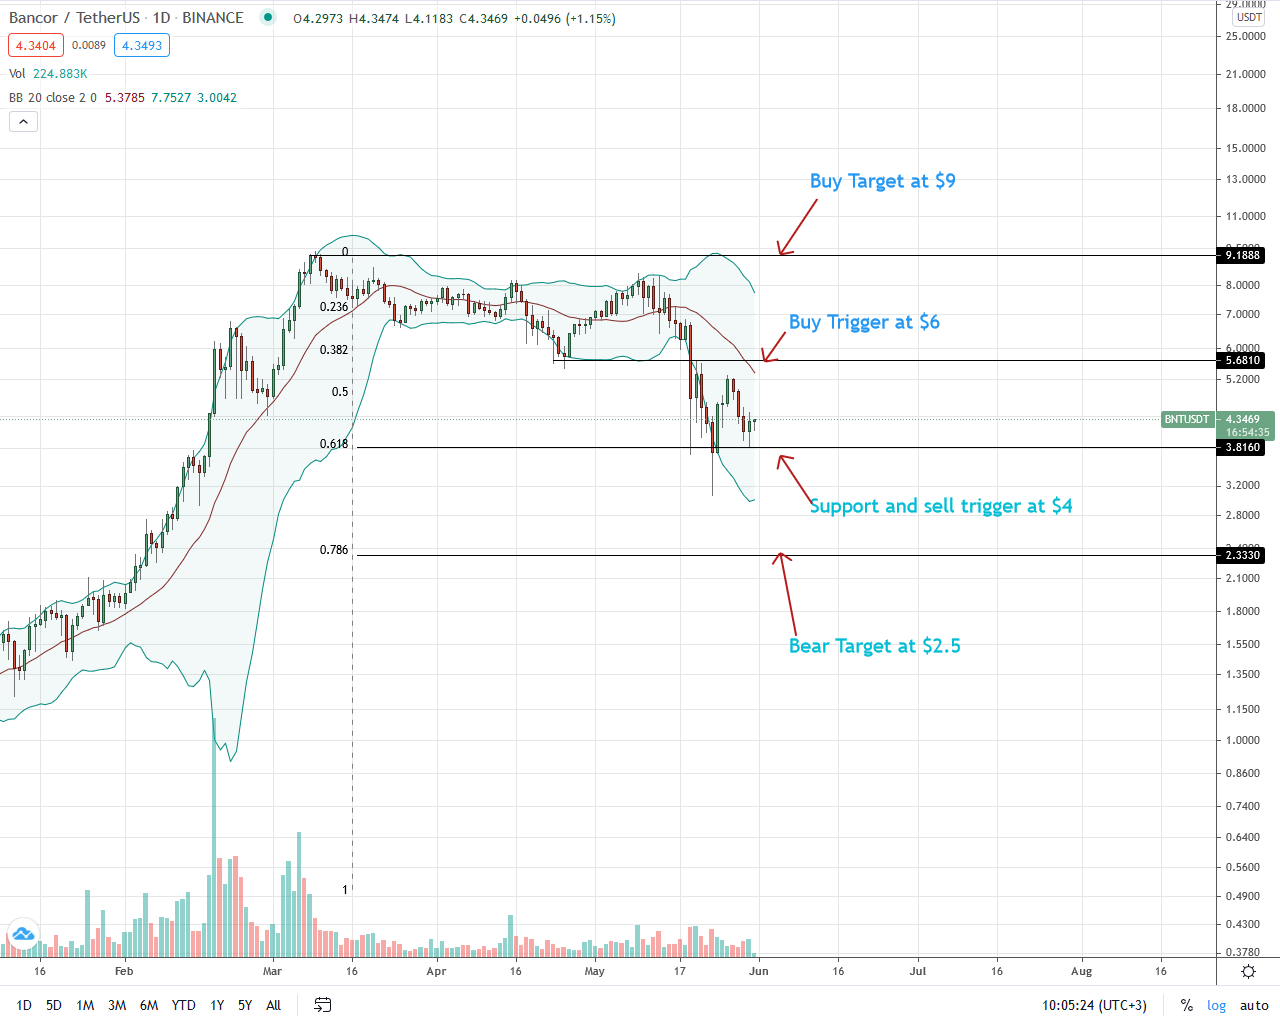
BNT/USDT technical analysis paint of a token in consolidation and under pressure. BNT prices are in range mode within a $2 range zone with identifiable caps at $4 and $6, respectively.
Since BNT prices are also within May 19 bear range, sellers have the upper hand. Still, the medium-term trajectory is determined by reaction at immediate resistance and support levels.
BNT/USDT Technical Analysis
Sellers are in charge as long as BNT prices are within May 19 bear trade range.
Still, gains above $6 may trigger demand with first bull targets at $9.
On the reverse side, losses below $4 could see BNT fall towards $2.5—the 78.6 percent Fibonacci retracement level of the Q1 2021 trade range in bear trend continuation.
UMA
The Ethereum-based protocol enables the creation of synthetics of various financial instruments. Its native token is UMA.
Past Performance of UMA
UMA prices are under pressure, and sellers are in control. For now, UMA/USDT prices are in range inside a broader sell setup.
On the last day, prices are generally stable against the USD, dropping two percent.
At the same time, trading volumes are down 24 percent to $24 million.
Day-Ahead and What to Expect
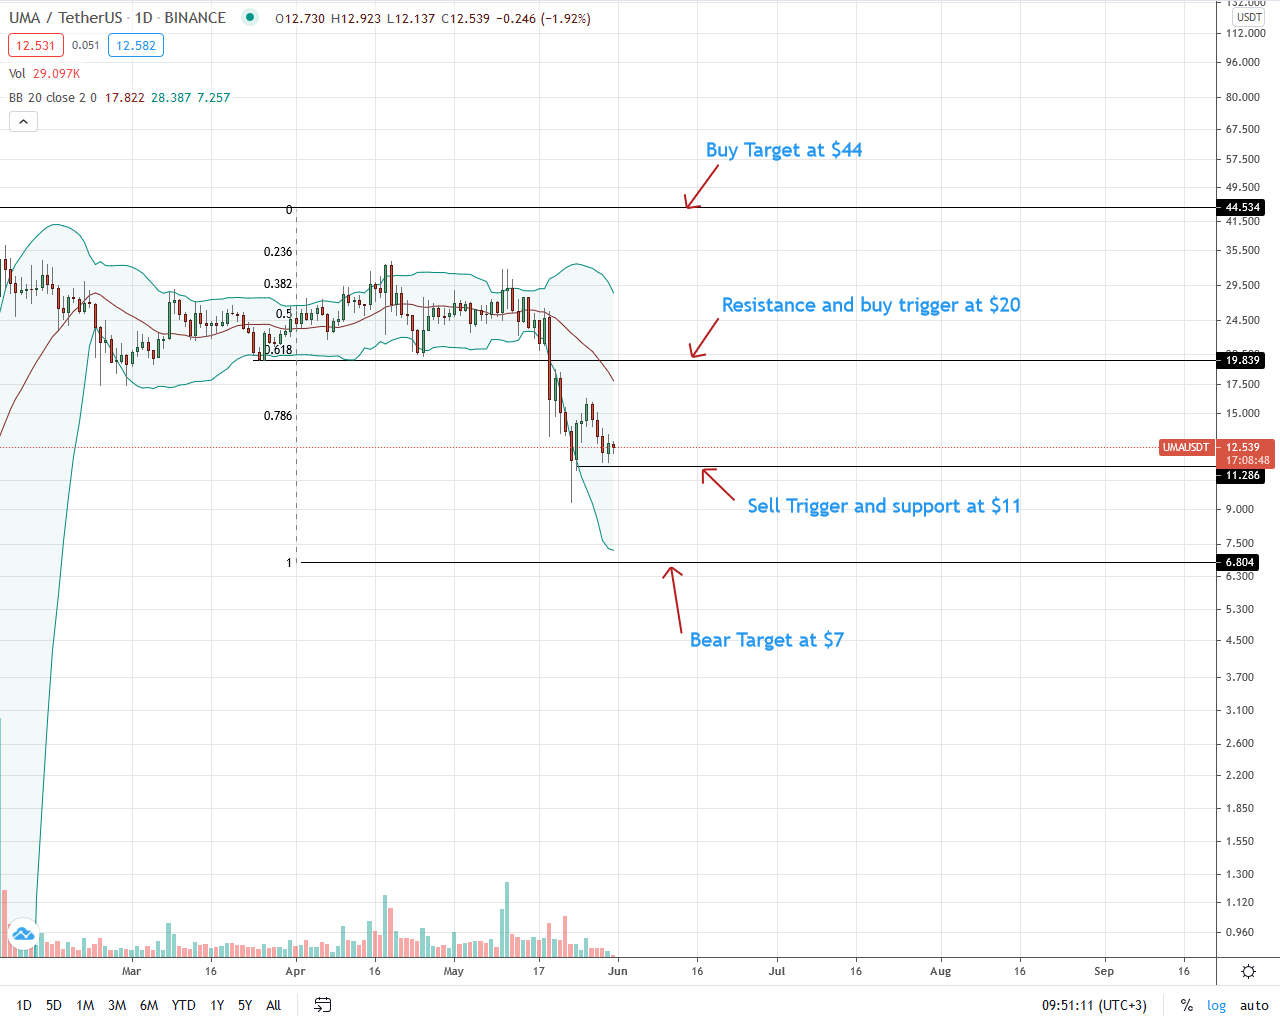
UMA/USDT prices are below the middle BB in a bear breakout pattern.
Even though prices are steady, the technical analysis points to sellers and possible bear trend continuation in the daily chart.
UMA/USDT prices are within May 19 trade range while subsequent bull bars are with lighter trading volumes, suggesting weakness from an Effort-versus-Results perspective.
UMA/USDT Technical Analysis
The token support lies at $11 and below the middle BB.
If bulls maintain prices above $11, every low above $16 may build demand, thrusting UMA/USDT towards $20—the main resistance level.
However, weakness below $11–in reflection of the May 19 dump–might spark a sell-off, driving UMA/USDT towards Q1 2021 lows of $7.
Source: https://www.cryptoknowmics.com/news/uma-and-bancor-bnt-technical-analysis-what-to-expect
- "
- active
- Altcoins
- analysis
- around
- Avalanche
- Bancor
- bars
- border
- breakout
- build
- Bulls
- charge
- consolidation
- DAO
- DApps
- day
- Demand
- driving
- Figure
- financial
- First
- flow
- governance
- HTTPS
- Level
- LINK
- Liquidity
- liquidity providers
- Long
- Market
- million
- Pattern
- performance
- perspective
- Posts
- pressure
- price
- Q1
- range
- reaction
- Recover
- reverse
- sell
- Sellers
- support
- support level
- Target
- Technical
- Technical Analysis
- time
- token
- Tokens
- trade
- Trading
- USD
- week
- within
- writing


