Loopring and Uniswap prices are melting if price action in the daily chart leads. As a result, UNI/USDT may slide below $18 to $10. At the same time, $0.25 could fail, forcing LRC/USDT prices towards $0.12.
Uniswap (UNI)
Uniswap is the largest DEX in Ethereum and the most liquid in the globe. UNI is the platform’s governance token.
Past Performance of UNI
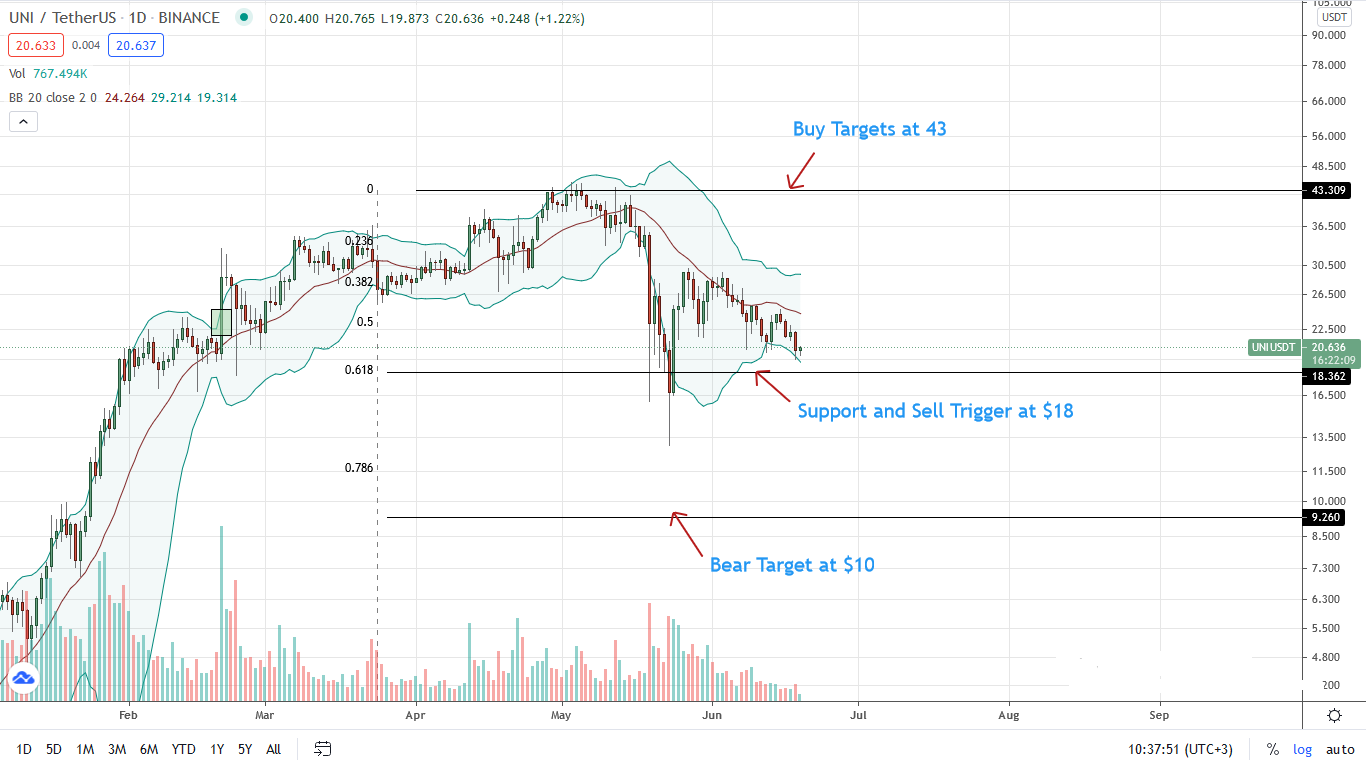
The middle BB continues to act as a reliable resistance line if price action in the daily chart leads.
As of writing, UNI bulls have failed to overcome sellers, cratering on June 18 below $20 towards May 2021 lows.
Currently, UNI is in red, losing five percent against the USD, with rising trading volumes at $330 million.
Day-Ahead and what to Expect
UNI sellers are in the driving seat and may force prices back to May 19 lows.
Given the rate of price deterioration and weakness in the uptrend, aggressive sellers can ride the trend lower, liquidating on pullbacks.
The primary support level lies at $18—the 61.8 percent Fibonacci retracement level of the first half of the 2021 trade range.
UNI/USDT Technical Analysis
The path of the least resistance is southwards, giving bears the upper hand.
Taking the lead from June 18 losses, UNI traders may find opportunities to sell the pullbacks. Their targets are at $18 and later at $10—the 78.6 percent Fibonacci retracement level of the aforementioned trade range.
A snap-back above $30 cancels the downtrend.
Loopring (LRC)
The Loopring platform is unique for its support of Layer-2, facilitating trustless swapping without high gas fees and delays. LRC is the primary currency.
Past Performance of LRC
At the time of writing, sellers are forcing prices lower, causing despair among traders.
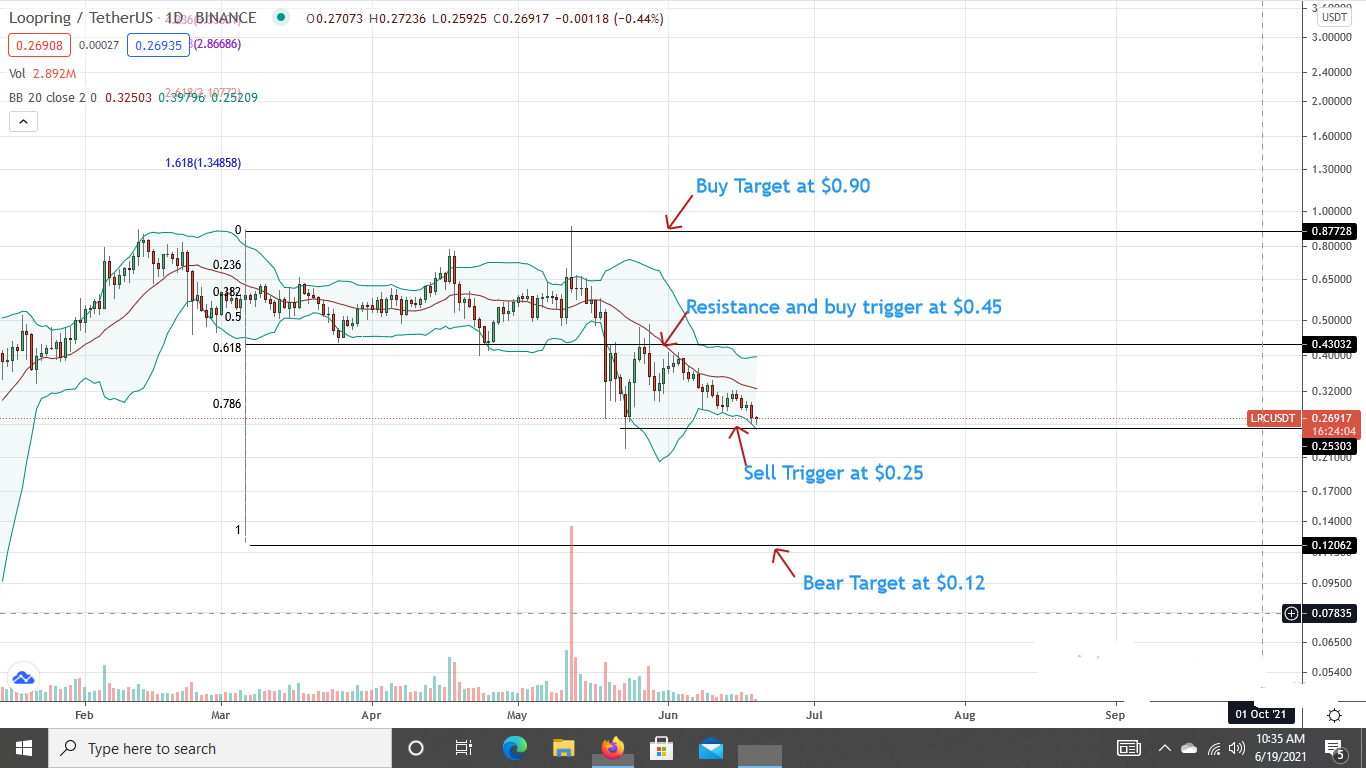
In the third section of a descending wedge, a break below looks imminent.
As of writing, LRC is down five percent as traders keep off. Trading volumes are down 22 percent to around $22 million.
Day-Ahead and what to Expect
The middle BB is the primary resistance as per price action in the daily chart.
On the flip side, $0.25 is the main support line and sell trigger.
The breakout direction of the LRC/USDT price will determine the short-term trend.
LRC/USDT Technical Analysis
Aforementioned, LRC sellers are in control.
Traders may opt to stay out until a clear trend forms.
A break above the middle BB, reversing this week’s losses, sets the pace for a race back to $0.45, drawing demand for LRC.
However, if LRC breaks below $0.25, prices may plunge to $0.12—the Q1 2021 lows.
- "
- Action
- active
- among
- analysis
- around
- Banks
- Bears
- border
- breakout
- Bulls
- capital
- continues
- crypto
- Currency
- delays
- Demand
- Dex
- driving
- ethereum
- Fees
- Figure
- First
- GAS
- gas fees
- Giving
- governance
- hacker
- High
- HTTPS
- lead
- Level
- Line
- Liquid
- million
- paradigm
- performance
- platform
- Posts
- price
- Q1
- Race
- range
- sell
- Sellers
- stay
- support
- support level
- Technical
- Technical Analysis
- time
- token
- trade
- Traders
- Trading
- Uniswap
- us
- USD
- writing


