Published 10 hours ago
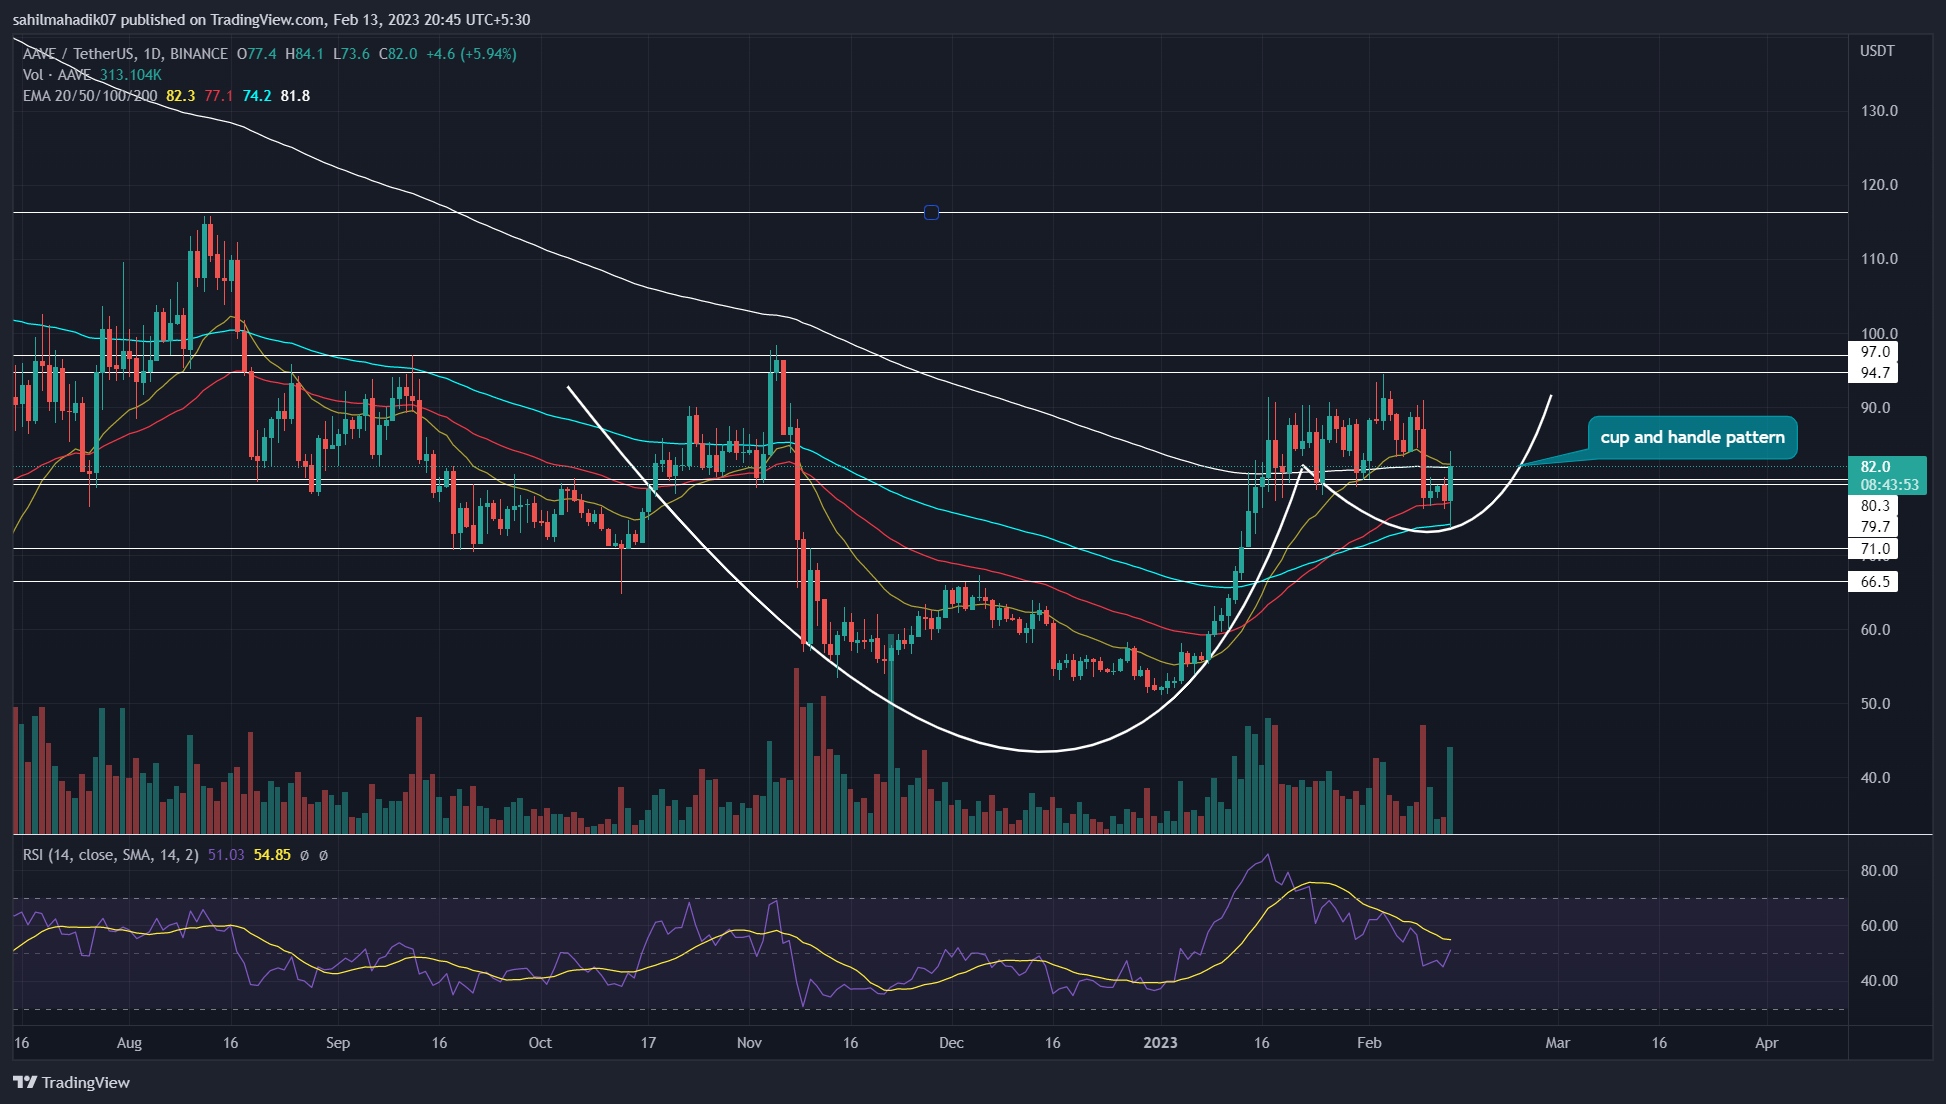
The past three months’ price action of AAVE coin price showed a simple formation of the cup and handle pattern. However, amid the recent sell-off, the AAVE price lost a crucial support of $80, indicating the bullish pattern got invalidated. Anyhow, a sudden price jump today $80, questions the credibility of the aforementioned breakdown,
advertisement
Key Points:
- A bullish breakout from the $80 barrier could set the AAVE price to reach the $97 mark.
- If the daily candle closing remains below $80, the holders may witness extended correction
- The intraday trading volume in AAVE is $188.8 Million, indicating a 293% gain

 Source- Tradingview
The last three-week consolidation phase was part of this bullish pattern, which should have replenished bullish momentum for future gains. However, with the increasing negativity in the market, the AAVE price breached the $80 support, weakening the aforementioned bullish thesis.
Anyhow, today, the AAVE price witnessed a significant inflow and pushed the prices back above the $80 mark. If the daily candle closes above the mentioned level, the prior breakdown will be considered a bear trap or a fake breakdown. Moreover, the aggressive short-sellers who entered the market may face forced liquidation and thus increase the buying orders in the market. If this happens, the bullish thesis will remain intact and so does the cup and handle pattern.
Trending Stories
Also Read: Top 10 DeFi Lending Platforms In 2023
Conversely, if the coin price remains below the $80 mark, the sellers will get an additional confirmation for price sustainability at a lower level and may trigger a longer correction phase. The potential downfall may reach $66.5 support.
Thus, the coin holders should wait for today’s daily candle closing as it may significantly influence the AAVE price’s near future.
Technical Indicator
EMAs: the flattish daily EMAs(20, 50, 100 and 200) signals a sideways trendline in the market
advertisement
RSI: The Relative Strength Index (RSI) is a popular oscillator technical indicator used to measure the strength of an asset’s price movement. Thus, a steady downfall from the RSI slope below the midline indicates the negative sentiment in the market is rising.
AAVE Coin Price Intraday Level
- Spot price: $81.8
- Trend: Bullish
- Volatility: Medium
- Resistance levels: $97 and $116
- Support levels: $80 and $71
Share this article on:
The presented content may include the personal opinion of the author and is subject to market condition. Do your market research before investing in cryptocurrencies. The author or the publication does not hold any responsibility for your personal financial loss.
- SEO Powered Content & PR Distribution. Get Amplified Today.
- Platoblockchain. Web3 Metaverse Intelligence. Knowledge Amplified. Access Here.
- Source: https://coingape.com/markets/aave-price-jumps-8-is-this-rally-a-bull-trap/
- 1
- 10
- 100
- 7
- 9
- a
- aave
- AAVE Price
- above
- Action
- Ad
- Additional
- aggressive
- Amid
- and
- article
- author
- avatar
- back
- barrier
- Beauty
- before
- below
- blockchain
- Breakdown
- breakout
- Brian
- bull
- bull trap
- Bullish
- Buying
- Closes
- closing
- Coin
- Coingape
- COM
- condition
- considered
- consolidation
- content
- correction phase
- could
- Credibility
- crucial
- cryptocurrencies
- cryptocurrency
- Cup
- daily
- DeFi
- DeFi lending
- different
- downfall
- entered
- Entertainment
- Face
- fake
- Fashion
- finance
- financial
- follow
- formation
- from
- future
- Gains
- get
- handle
- happens
- hold
- holders
- HOURS
- However
- HTTPS
- in
- include
- Including
- Increase
- increasing
- index
- indicates
- Indicator
- influence
- investing
- IT
- journalism
- jump
- jumps
- Last
- lending
- Level
- levels
- Liquidation
- longer
- loss
- mark
- Market
- market research
- measure
- mentioned
- million
- Momentum
- movement
- Near
- negative
- Opinion
- orders
- part
- past
- Pattern
- personal
- phase
- Platforms
- plato
- Plato Data Intelligence
- PlatoData
- plugin
- points
- Popular
- potential
- presented
- price
- PRICE ACTION
- Prices
- Prior
- Publication
- pushed
- Questions
- rally
- reach
- Read
- recent
- remain
- remains
- research
- responsibility
- rising
- rsi
- sell-off
- Sellers
- sentiment
- set
- Share
- should
- sideways
- signals
- significant
- significantly
- Simple
- Slope
- So
- steady
- strength
- subject
- sudden
- support
- Sustainability
- Technical
- The
- three
- to
- today
- today’s
- Topics
- Trading
- trading volume
- TradingView
- trending
- trigger
- variety
- volume
- wait
- which
- WHO
- will
- witness
- witnessed
- working
- written
- years
- Your
- zephyrnet


