ALICE market trading ended with the absorption of positive buyers’ results last week. The ALICE price has every chance to close below the opening price and give sellers the prospect of testing the $11 mark last week. In the weekly timeframe, we see that this mark is not very clearly highlighted on the chart. It is much better to notice the range of $9-$10. In this range, buyers have formed a full resistance zone, which reflects all attempts by sellers to continue to fall to $5.5-$6.
In the chart, we see that after the last meeting of the price with the $9-$10 range, the ALICE price suddenly jumped to $18. It happened in the week of 25 October and comparing with the ADA market, ALICE spent this week very aggressively. Interestingly, in addition to the $9-$10 test, buyers also kept the main trend line, which constantly pushes the ALICE price to break the main range of $19-$20. This trend line is under the control of buyers from June 2021. That is why at the moment the mark of $11 is the maximum allowable target of sellers in case of poor closing of the current weekly candle. By lowering prices below the medium-term trend of buyers will be broken and expect the growth of the ALICE market by the end of the year will be useless.
Technical Analysis of ALICE in the Daily Timeframe

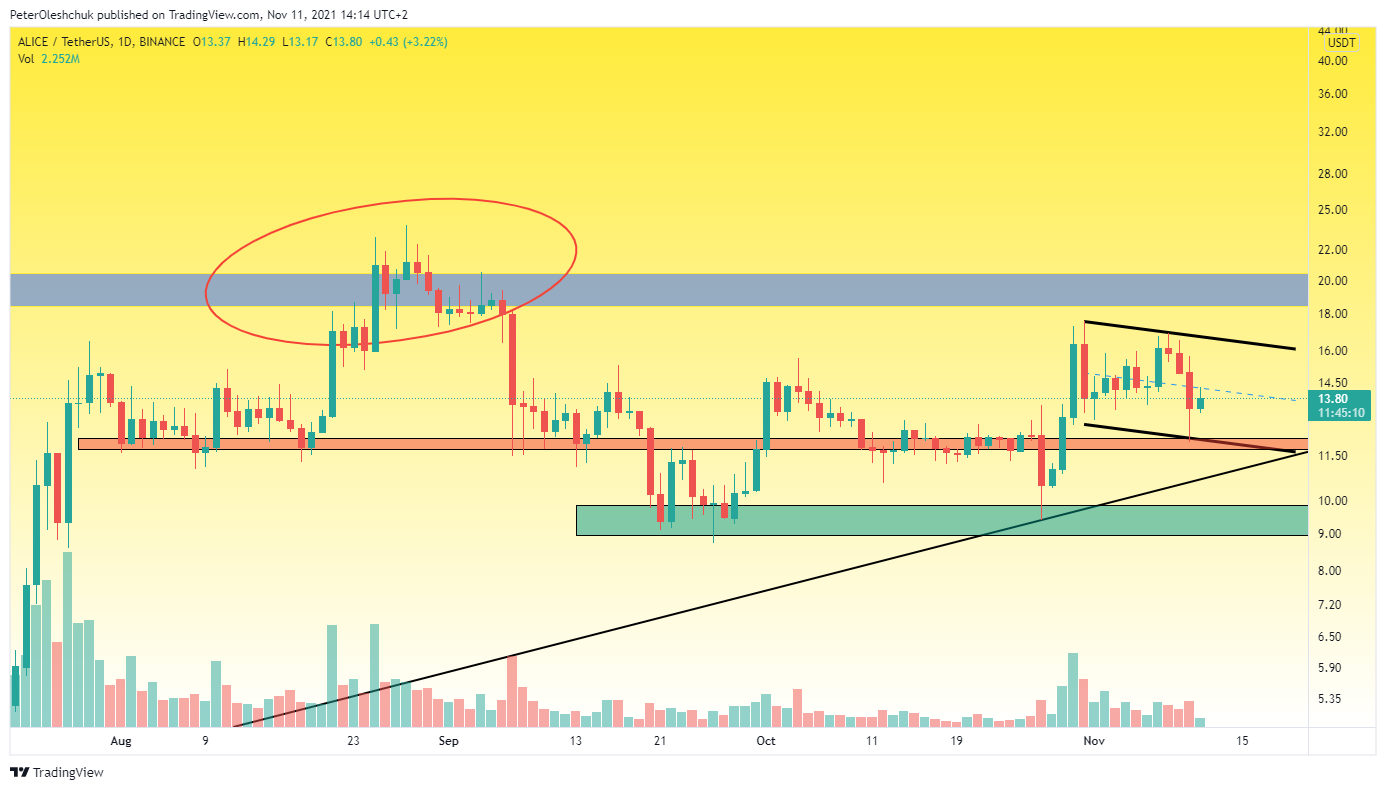
However, if you carefully analyze the daily price chart in the ALICE market, sellers may not be able to test even the mark of $11. To successfully continue the trend of buyers, the price should not fall below the range of $11.7-$12. Although sellers have managed to break through this range in history, it is much more iconic than the liquidity zone of $9-$10.
First, in the range of $11.7-$12, a large position of buyers was gained for a strong long-term growth trend of ALICE. This can be clearly seen starting on 1 August. From this date in this range, there is a constant consolidation as the price sticks to it. This fact speaks of great interest. The failure of sellers to break this range down will indicate that the main position of buyers has already been gained, and it’s time to start the rally. Given the positive dynamics of Bitcoin and its plans to continue to grow with the first target of $77,000, the chances of such a scenario are maximum.
The ALICEBTC Price Predicts Another Week of Fall

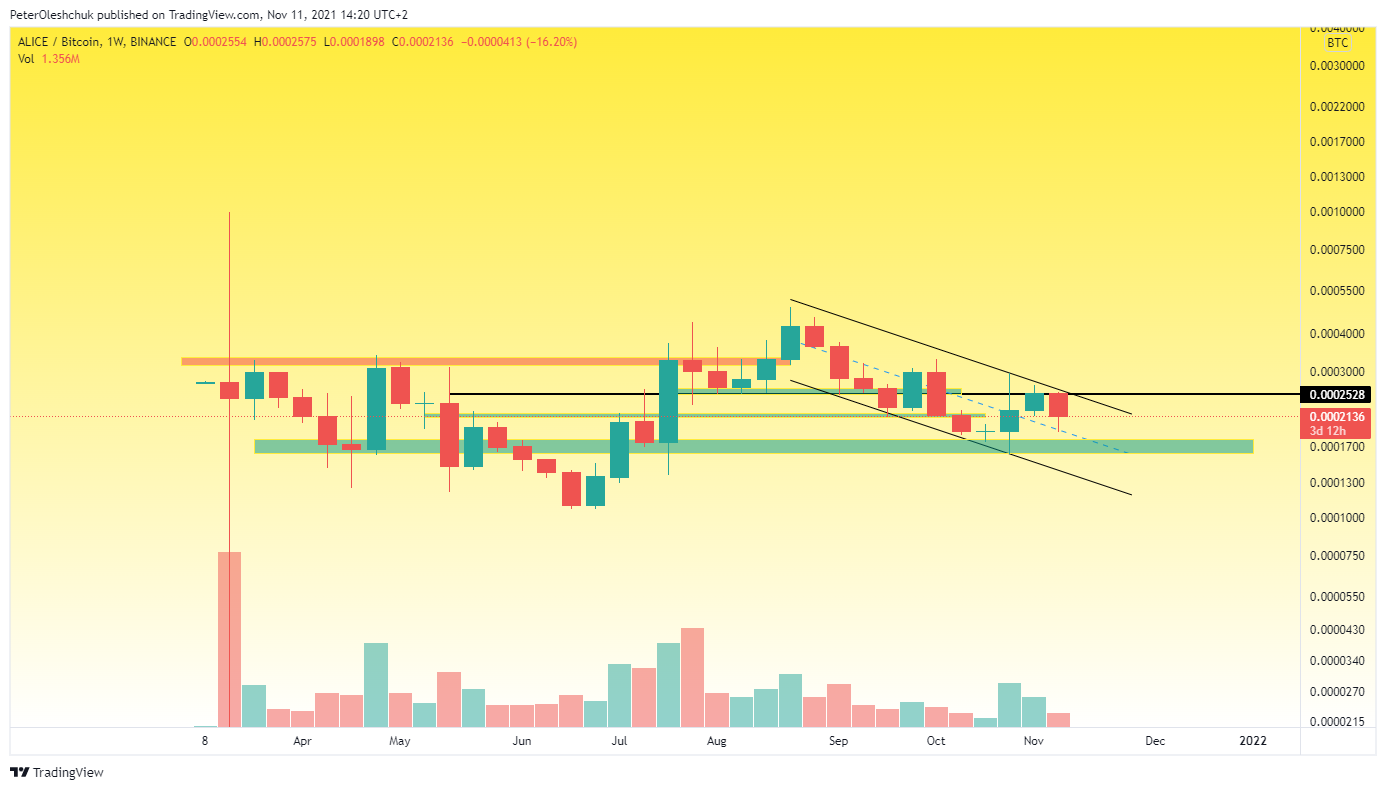
If you consider the movement of the ALICEBTC price on the weekly timeframe, you can see the local correction channel of the fall. Buyers have not yet been able to break it and next week has every chance to reduce the ALICEBTC price. If buyers do not allow the local low to be updated during this local fall, this will be the first signal to start reversing the ALICEBTC price and repeated attempts to break 0.00025. This mark stopped buyers last week and taking control of it will open all roads for a medium-term growth wave.


