- There is a potential for a 460% to 520% profit on KSM.
- KSM is currently trading at $25.15 after a 2.10% increase in price.
- The daily RSI line for KSM recently crossed above the daily RSI SMA line.
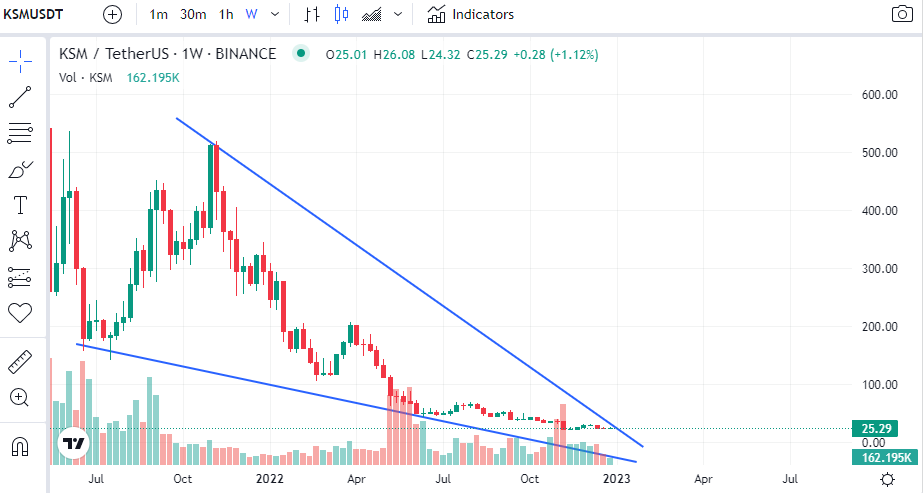
A crypto analyst took to Twitter early this morning to share some observations about Kusama (KSM). According to the post, traders should look at a mid-term hold for KSM. The analyst pointed out the falling wedge forming on KSM’s weekly chart and added that there is a potential for a 460% to 520% profit.

Data from CoinMarketCap indicates that KSM is currently trading at $25.15 after a 2.10% increase in price over the last 24 hours, and after reaching a high of $25.37 over the same time period. The crypto is also still in the green by more than 3% over the last week.
KSM was able to strengthen against the two biggest crypto in the market, Bitcoin (BTC) and Ethereum (ETH), by about 2.68% and 2.41% respectively.
The 24-hour trading volume for KSM, however, is in the red zone and currently stands at $8,787,080 after a more than 15% decline since yesterday. With its market cap of $213,031,415, KSM is the 108th biggest crypto in terms of market capitalization.

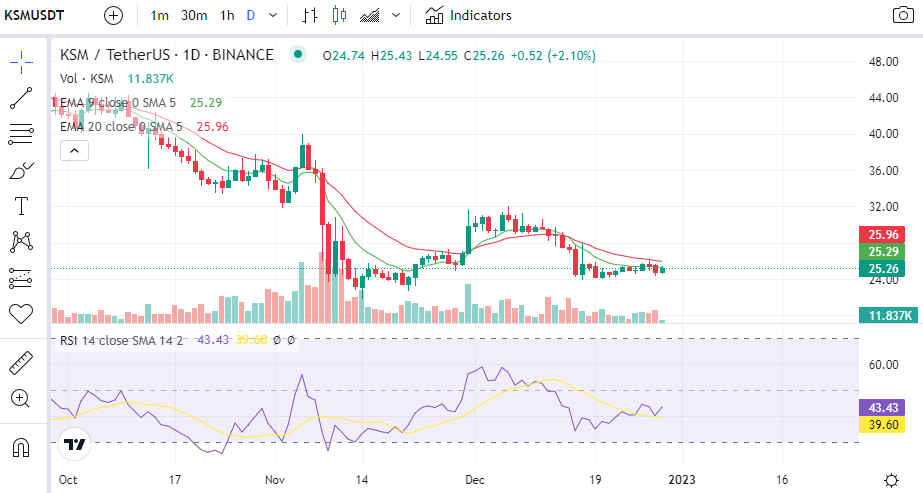
Looking at the daily chart for KSM/USDT, the price of KSM is looking to challenge the 9-day EMA line, which is bearishly positioned below the 20-day EMA line. A fresh bullish flag is the daily RSI line’s recent cross above the daily RSI SMA line. In addition to this, the RSI line is positively sloped towards the overbought territory.
Should KSM’s price successfully break above the 9-day EMA line, then a confirmation of a bullish pump will be when it breaks above the 20-day EMA as well.
Disclaimer: The views and opinions, as well as all the information shared in this price analysis, are published in good faith. Readers must do their own research and due diligence. Any action taken by the reader is strictly at their own risk. Coin Edition and its affiliates will not be held liable for any direct or indirect damage or loss.
Post Views: 2
- Bitcoin
- blockchain
- blockchain compliance
- blockchain conference
- Coin Edition
- coinbase
- coingenius
- Consensus
- crypto conference
- crypto mining
- cryptocurrency
- decentralized
- DeFi
- Digital Assets
- ethereum
- Kusama (KSM)
- machine learning
- news
- non fungible token
- plato
- plato ai
- Plato Data Intelligence
- PlatoData
- platogaming
- Polygon
- Price Analysis
- proof of stake
- W3
- zephyrnet


