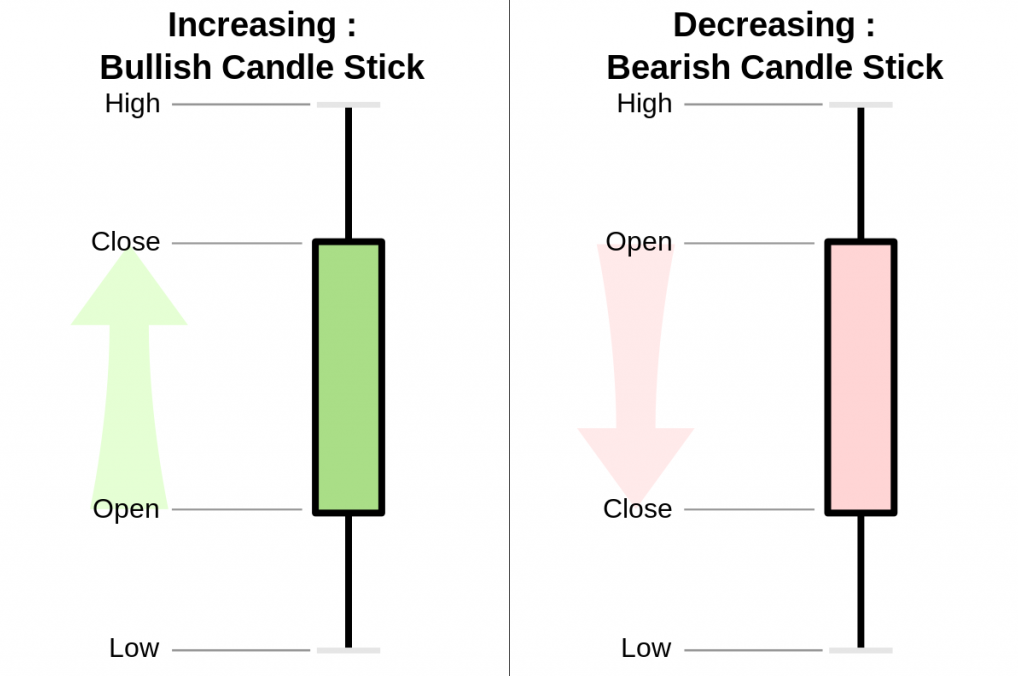
They call them Candles. Maybe because they make your heart flicker every time they go up or down…

So I went to a broker (that’s the middleman, the exchange that hosts the marketplace). I use Binance-Futures, or TradingView if I wanted just to observe and analyze the charts. Now, every chart we look at, every couple of goods we choose to observe, can be looked at at different time-frames. That means I can track how the price changes every couple of minuteshoursdaysetc. But what the *pip* are those boxes with sticks coming out of them?!
These are Japanese Candlesticks, and they can show you the price change in that time-frame. By default, their color is green for a candlestick that signs for a price shifting up (also professionally called “Bullish”) or red for a candlestick that signs for a price shifting down (also professionally called “Bearish”). The candlestick (the box) represents the price at the start of the time-frame (opening price) and at the end of the time-frame (closing price), and the wicks (the sticks) represents the entire range of prices at this time-frame which can be larger than the opening and closing prices alone.
“The Moving Average” channel has good videos explaining candlestick charts and time-frames.
Apparently, these candlesticks not only present 4 key-values of a time-frame, but they also contain some momentum information. In mechanics, as we learned in high-school physics, momentum is a body’s “power of movement” in a specific direction that can be changed by a force applied on the body. Also on the candlestick chart, if a momentum shows a change, it is because the market applied an opposite force on it, and maybe these forces are enough to flip the momentum entirely.
I’ve learned that there are quite a lot of patterns, some give more accurate predictions of the market momentum and some are less accurate. The engineer that I am, I spent my time memorizing just the ones with the highest accuracy. Nonetheless, these all are suggested to be used along with another indicator for momentum change.
Engulfing candles
This is the simplest pattern there is. It is the previous trend’s candle followed by the opposite direction candle with a body longer than the first. This pattern can indicate a change of momentum.
“The Moving Average” channel video explaining candlestick charts also cover this pattern.
Three line strike
This is a pattern where three consecutive candles are followed by an opposite-direction candle with a body longer than the three. This is like a triple-engulfing candle.
“The Moving Average” channel has a video covering this pattern.
Doji pattern
Dojis are when the candle opens and closes at the same price. A Doji at the middle (standard Doji) means that the market isn’t leaning towards any trend. A Doji at the top or bottom (dragonfly and gravestone Doji, respectively) show a great amount of momentum built towards an uptrend or downtrend, respectively. So dragonfly Doji is bullish and gravestone Doji is bearish. Of course, this is just if another indicator points for the same momentum change.
“The Moving Average” channel has a video covering this pattern.
Hammer/Shootingstar pattern
Hammer and Shootingstar candlesticks are just like dragonfly and gravestone Doji, just with slightly more body to them. Therefore, although they too are bullish and bearish signals, respectively, they need another candle after them that shows the same trend as they flip into.
“The Moving Average” channel has a video covering this pattern.


