Talking Points
- Australia’s Employment Change and Unemployment Rate
- AUS/USD Weekly Chart Technical Analysis and COT Update
- AUD/USD 1-hour Chart Technical Analysis
Australia’s Employment Change and Unemployment Rate
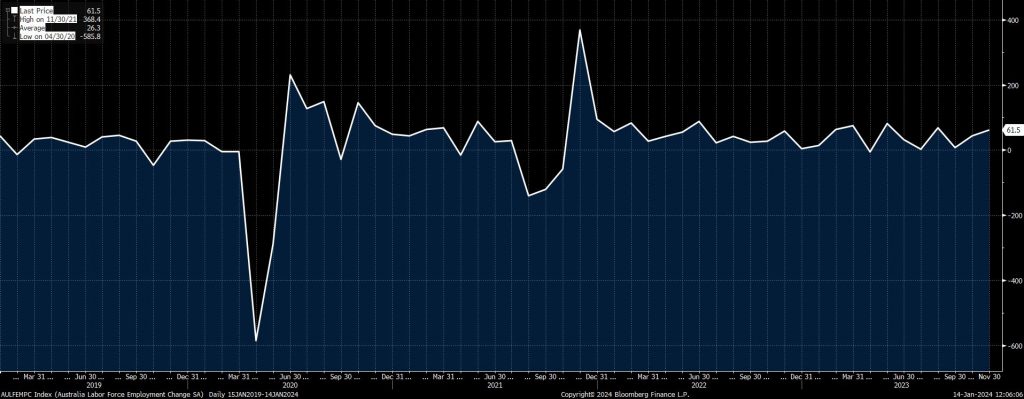
- The Employment Change numbers in Australia have been steady and often beating its forecasts for the past few months; the forecasted change in Employment for December 2023 numbers reflects a potential shift in course; the change is expected at 15.4K compared to 61.5K for November 2023. However, if the actual numbers beat the forecast, it may cause traders to be on edge at the news release time due to potential high volatility; no change is expected for the Unemployment Rate from its previous reading of 3.9%
AUS/USD Weekly Chart Technical Analysis
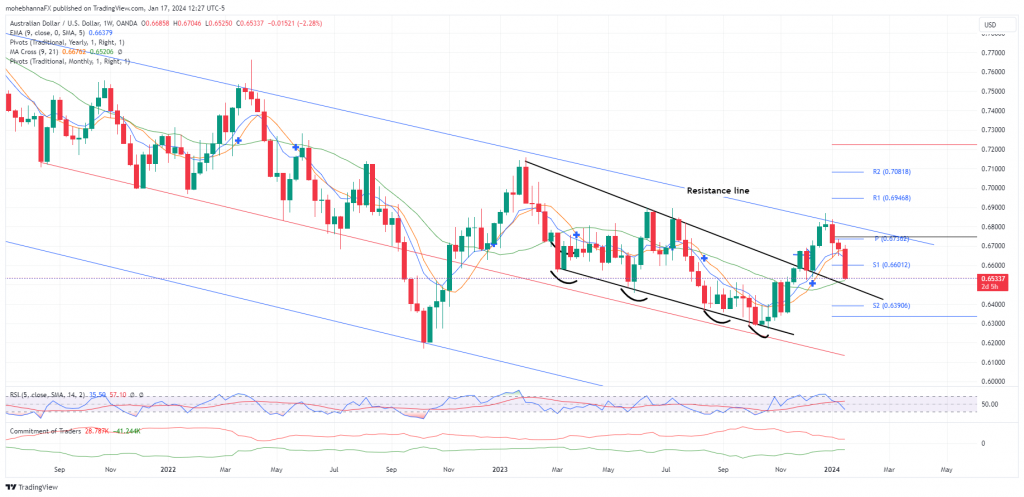
- Large speculators are building long positions while commercials are adding shorts. However, the position level for both categories is at a 3-year extreme, signaling a potential change in sentiment. It is also worth noting that Small Speculators are well within the long territory and are also at an extreme level.
- Price action continues to trade within the previously identified descending channel; the bullish momentum was met by strong resistance upon reaching the upper channel resistance line (Blue lines), and the price fell from 0.6820 down to 0.6525 over the past three weeks.
- A multiple-bottom formation pattern within the channel is complete, and the price action broke above the inverted bottom baseline, which was followed by a throwback to the baseline as well as the SMA21, where price action is finding support so far. (Black line)
- The price is trading below its EMA9 and SMA9; it broke below the two averages but has yet to close.
- RSI aligns with price action, crossing below its MA and heading towards its oversold territory.
AUD/USD 1-hour Chart Technical Analysis
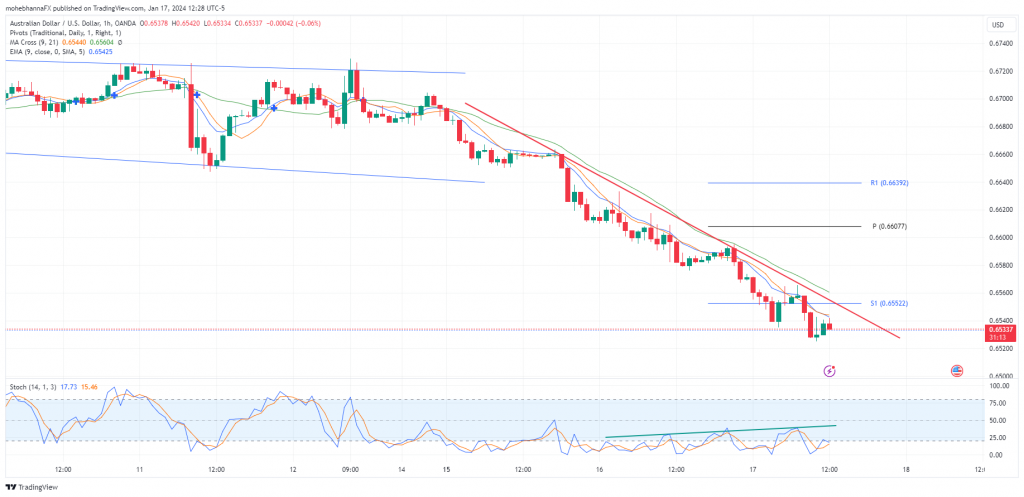
- Looking at shorter time frames and the recent price action, a trading range can be identified as the price has been trading within this range for a few days. The upper resistance line for the range intersects with the monthly pivot point and the weekly R1 calculations, thus representing a confluence of resistance ahead of any further upside price action.
- Price broke below the trading range and is currently in a downtrend (Red line) on the 1-hour timeframe; however, a positive divergence on the Stochastic indicator can be identified as price action is making lower highs while Stochastics is making higher highs (Green line), The Stochastic indicator is at its oversold level, and the %K line crossed above the %D line.
- Previous Support level S1 (Currently turned resistance) intersects with the downtrend line (Red line), thus creating an interesting zone to watch for a potential breakout.
- Price action is trading below its EMA9, MA9, and MA20; the intersection of the three averages represents a resistance level above the market price, which is also close to the red line.
Content is for general information purposes only. It is not investment advice or a solution to buy or sell securities. Opinions are the authors; not necessarily that of OANDA Business Information & Services, Inc. or any of its affiliates, subsidiaries, officers or directors. If you would like to reproduce or redistribute any of the content found on MarketPulse, an award winning forex, commodities and global indices analysis and news site service produced by OANDA Business Information & Services, Inc., please access the RSS feed or contact us at info@marketpulse.com. Visit https://www.marketpulse.com/ to find out more about the beat of the global markets. © 2023 OANDA Business Information & Services Inc.
- SEO Powered Content & PR Distribution. Get Amplified Today.
- PlatoData.Network Vertical Generative Ai. Empower Yourself. Access Here.
- PlatoAiStream. Web3 Intelligence. Knowledge Amplified. Access Here.
- PlatoESG. Carbon, CleanTech, Energy, Environment, Solar, Waste Management. Access Here.
- PlatoHealth. Biotech and Clinical Trials Intelligence. Access Here.
- Source: https://www.marketpulse.com/newsfeed/aud-usd-technical-analysis-australian-dollar-employment-change/mhanna
- :has
- :is
- :not
- :where
- 15 years
- 15%
- 2023
- 4k
- 7
- 700
- a
- About
- above
- access
- Action
- actual
- adding
- advice
- affiliates
- ahead
- Aligns
- also
- an
- analysis
- and
- any
- ARE
- AS
- At
- AUD/USD
- Australia
- Australian
- Australian dollar
- author
- authors
- avatar
- award
- Baseline
- BE
- beat
- been
- below
- Black
- Blue
- both
- Bottom
- Box
- breakout
- Broke
- Building
- Bullish
- business
- but
- buy
- by
- calculations
- CAN
- categories
- Cause
- CFTE
- change
- Channel
- Chart
- client
- clients
- Close
- COM
- commercials
- Commodities
- compared
- complete
- confluence
- contact
- content
- continues
- Course
- Creating
- Crossed
- crossing
- Currently
- daily
- Days
- December
- designation
- Directors
- Divergence
- Dollar
- down
- downtrend
- driving
- due
- Edge
- employment
- expected
- experience
- extreme
- far
- few
- financial
- Financial institutions
- Find
- finding
- followed
- For
- Forecast
- forecasts
- forex
- Forex markets
- formation
- found
- from
- further
- General
- Global
- global markets
- Globally
- Green
- Have
- he
- Heading
- High
- higher
- Highs
- holds
- However
- HTTPS
- identified
- if
- in
- Inc.
- Indicator
- Indices
- information
- Institutional
- institutional clients
- institutions
- interesting
- intersection
- investment
- IT
- ITS
- jpg
- Level
- like
- Line
- lines
- Long
- lower
- Making
- Market
- Market Analysis
- MarketPulse
- Markets
- max-width
- May..
- member
- met
- Momentum
- monthly
- months
- more
- necessarily
- news
- news release
- no
- noting
- November
- number
- numbers
- of
- officers
- often
- on
- only
- Opinions
- or
- out
- over
- past
- Pattern
- photo
- Pivot
- plato
- Plato Data Intelligence
- PlatoData
- please
- Point
- position
- positions
- positive
- Posts
- potential
- previous
- previously
- price
- PRICE ACTION
- Produced
- Publishing
- purposes
- range
- Rate
- reaching
- Reading
- recent
- recognized
- Red
- reflects
- relations
- release
- representing
- represents
- research
- Resistance
- retail
- rss
- sales
- Securities
- sell
- sentiment
- service
- Services
- sharing
- shift
- shorts
- Sides
- site
- small
- So
- so Far
- solution
- specializes
- steady
- strong
- support
- support level
- Technical
- Technical Analysis
- territory
- that
- The
- The Weekly
- this
- three
- Thus
- time
- timeframe
- to
- top
- towards
- trade
- Traders
- Trading
- Turned
- two
- unemployment
- unemployment rate
- upon
- Upside
- us
- v1
- Visit
- Volatility
- was
- Watch
- weekly
- Weeks
- WELL
- which
- while
- winning
- with
- within
- worked
- worth
- would
- years
- yet
- You
- zephyrnet


