SNEAK PEEK
- BTC shows a bearish trend with a negative CMF score and Fisher Transform rating.
- Rising trading volume suggests possible price reversal and an upward trend.
- An oversold market and a weakening downtrend indicate potential consolidation before reversal.
Bitcoin (BTC) has slipped back after failing to break over the $30k barrier level at the 24-hour high of $30,555.54 over the weekend. During the recession, the Bitcoin price fell to a 24-hour low of $29,816.72, where it found support. If
The $30,270-$32,150 resistance remains a tough hurdle for #Bitcoin where 770K addresses bought 360K $BTC.
Meanwhile, the $29,330-$30,200 support holds strong where 700K addresses bought 390K $BTC. Be cautious ⚠️ if this level breaks, the next key support is at $27,600-$28,450. pic.twitter.com/sw8UC0LbC9
— Ali (@ali_charts) April 16, 2023
As of press time, the bears have taken control of the Bitcoin market, causing the price to fall by 1.61% to $29,895.18. If the bullish momentum fails to regain control and the $29,816.72 support level is violated, the next support level to monitor is $28,000. However, if the bulls can drive the price over $30,000 and keep it there, it might suggest a probable trend reversal.
Buy $BTC and keep it off exchanges! Once it breaks $31,000 there is no resistance ahead until.$38,000 https://t.co/aKad7Zz1vg
— Ali (@ali_charts) April 16, 2023
While the market capitalization fell by 1.67% to $577,777,167,139, the 24-hour trading volume increased by 29.84% to $14,998,585,699. This movement indicates a possible change in investor mood, with more traders buying and selling BTC despite the recent dip in value.
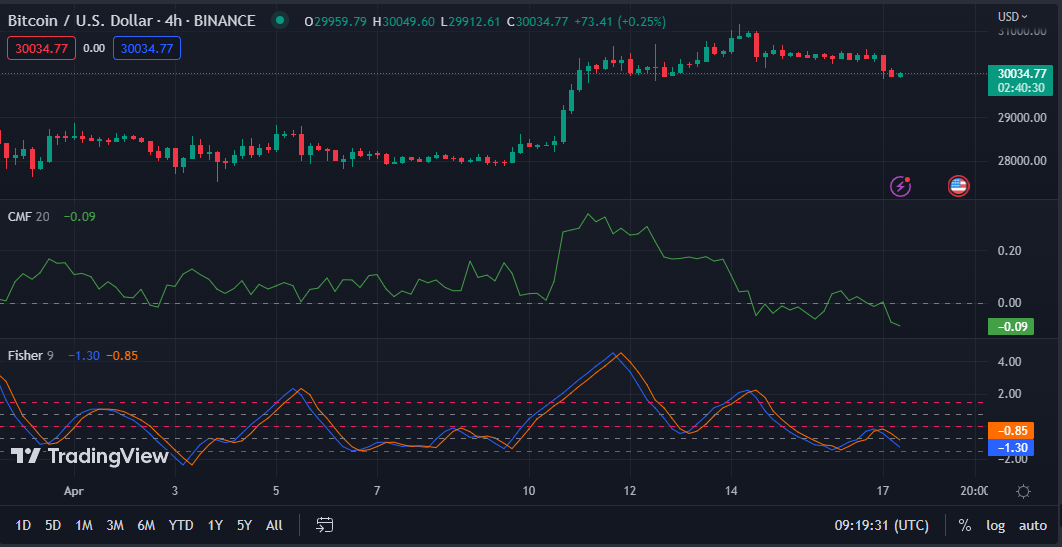
On the BTCUSD price chart, the Chaikin Money Flow score of -0.09 shows that the present negative trend may persist in the near term. This CMF score shows Bitcoin’s “selling pressure” and suggests that traders are selling more than purchasing now.
Because it is in negative territory, investors may view this as a bearish signal and decide to wait for a better purchasing opportunity.
With a Fisher Transform rating of -1.30 and movement below its signal line, BTC bearishness is verified, suggesting that caution is recommended when considering buying in BTC. This Fisher Transform trend indicates an increase in bear strength, and traders may wish to wait for a reversal before establishing long BTC positions.

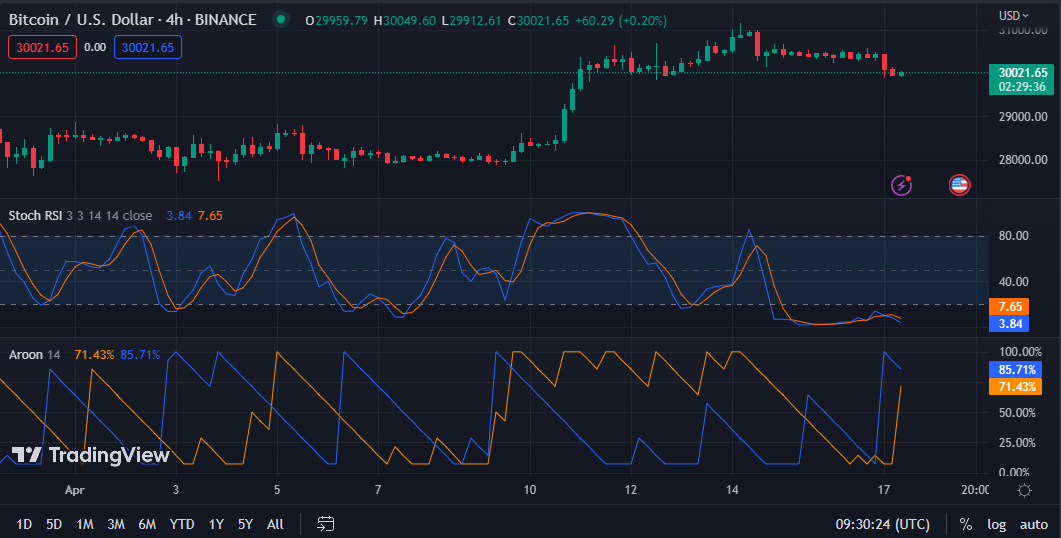
The stochastic RSI reading of 4.59 on the BTC 4-hour price chart indicates that the market is “oversold” and that traders wanting to join the market at a lower price point may have a possible purchasing opportunity.
The rising trading volume suggests market players’ increased interest in the present price level, which might lead to a price reversal and an upward trend in the near future.
With an Aroon down reading of 85.71% and an Aroon up reading of 71.43%, the current trend seems bearish, but there is some hope for a reversal due to the close proximity of the two indicators. The difference of 14.28 indicates a weakening of the downtrend, which might imply a consolidation period before a potential reversal.

Bitcoin’s recent dip below $30k and negative indicators suggest a bearish trend, but the increased trading volume and the oversold market may offer a buying opportunity.
Disclaimer: Cryptocurrency price is highly speculative and volatile and should not be considered financial advice. Past and current performance is not indicative of future results. Always research and consult with a financial advisor before making investment decisions.
- SEO Powered Content & PR Distribution. Get Amplified Today.
- Platoblockchain. Web3 Metaverse Intelligence. Knowledge Amplified. Access Here.
- Minting the Future w Adryenn Ashley. Access Here.
- Source: https://investorbites.com/bitcoin-btc-price-analysis-17-04/
- :is
- $UP
- 000
- 1
- 28
- 7
- 8
- a
- addresses
- advice
- advisor
- After
- ahead
- always
- analysis
- and
- ARE
- AS
- At
- back
- barrier
- BE
- Bear
- bearish
- Bears
- before
- below
- Better
- Bitcoin
- Bitcoin market
- Bitcoin News
- Bitcoin Price
- Bitcoin Price Analysis
- bought
- Break
- breaks
- BTC
- BTC/USD
- BTCUSD
- btcusd price
- Bullish
- Bulls
- Buying
- by
- CAN
- capitalization
- causing
- cautious
- Center
- change
- Chart
- Close
- considered
- considering
- consolidation
- control
- Current
- decide
- decisions
- Despite
- difference
- Dip
- down
- drive
- during
- establishing
- external
- fails
- Fall
- financial
- financial advice
- flow
- For
- found
- future
- Have
- High
- highly
- holds
- hope
- However
- HTTPS
- in
- Increase
- increased
- indicate
- indicates
- Indicators
- interest
- internal
- investment
- investor
- Investors
- IT
- ITS
- join
- Keep
- Key
- lead
- Level
- Line
- Long
- Low
- Making
- Market
- Market Capitalization
- Market News
- May..
- might
- Momentum
- money
- Monitor
- more
- movement
- Near
- negative
- negative territory
- news
- next
- of
- offer
- Offers
- on
- Opportunity
- past
- performance
- period
- plato
- Plato Data Intelligence
- PlatoData
- Point
- positions
- possible
- potential
- present
- press
- price
- Price Analysis
- price chart
- purchasing
- rating
- Reading
- recent
- recession
- recommended
- remains
- research
- Resistance
- Results
- Reversal
- rising
- rsi
- score
- seems
- Selling
- should
- Shows
- Signal
- some
- Source
- strength
- strong
- Suggests
- support
- support level
- territory
- that
- The
- time
- to
- Traders
- Trading
- trading volume
- TradingView
- Transform
- Trend
- upward
- value
- verified
- View
- volatile
- volume
- wait
- wanting
- weekend
- What
- What is
- What is bitcoin
- which
- with
- zephyrnet


