SNEAK PEEK:
- BLUR/USDT pair experiences high volatility during the week.
- The bulls gained momentum in the last 24 hours.
- According to the 4-hour chart, the short-term market mood is bearish.
Blur’s price prediction suggests that the market has been quite volatile as bulls and bears demonstrate their strengths and weaknesses during the week. Consequently, the BLUR/USDT currency pair had higher highs of $1.3801, $1.3548, and lower lows of $0.8748, $0.8997 throughout the week.
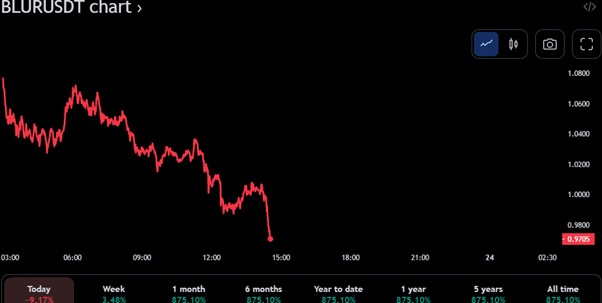
However, in the previous 24 hours, the bulls have gained the upper hand in market sentiment, driving the BLUR/USDT price higher. The BLUR/USDT pair trades between $1.07 and $0.9149, which function as resistance and support levels, respectively.
At the time of writing, the price of the BLUR/USDT pair went up by 7.13%, hitting $1.03. The market capitalization increased by 7.77% to $400 million, while the trading volume decreased by 45.96% to 318 million in the last 24 hours.

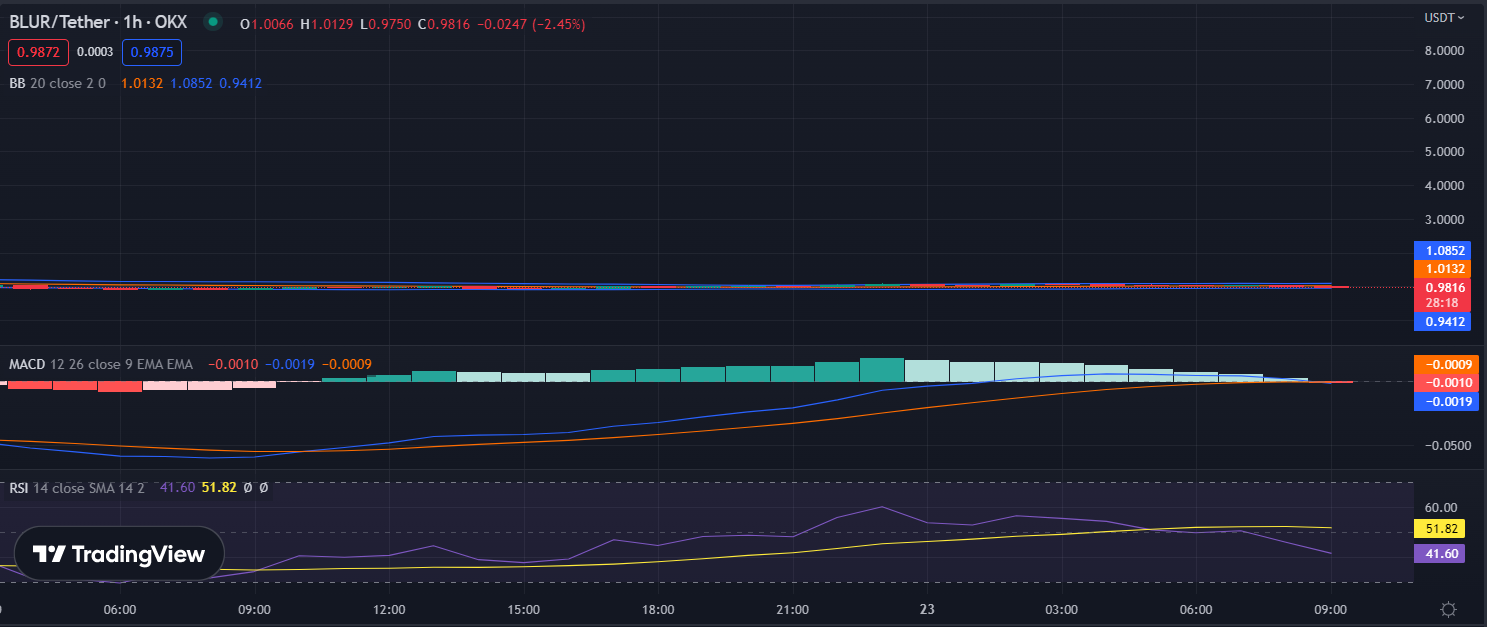
According to the BLUR/USDT 1-hour chart, the uptrend momentum is robust, as evidenced by the Relative Strength Index (RSI), which has risen to 51.90, showing that the bulls are in charge of the market. Furthermore, the Moving Average Convergence Divergence (MACD) demonstrates a bullish crossover, with the MACD line crossing over the signal line, suggesting that momentum is rising.
The Bollinger bands are linear, implying that market volatility has been minimal and that the market is trading inside a specific range. The top bar is at 1.0850, while the lower band is at 0.9420, showing that buying pressure is consistent in the market and may move in the short term.
Overall, these signs suggest a significant purchasing impulse in the market and low volatility, indicating that now is an excellent time to purchase.

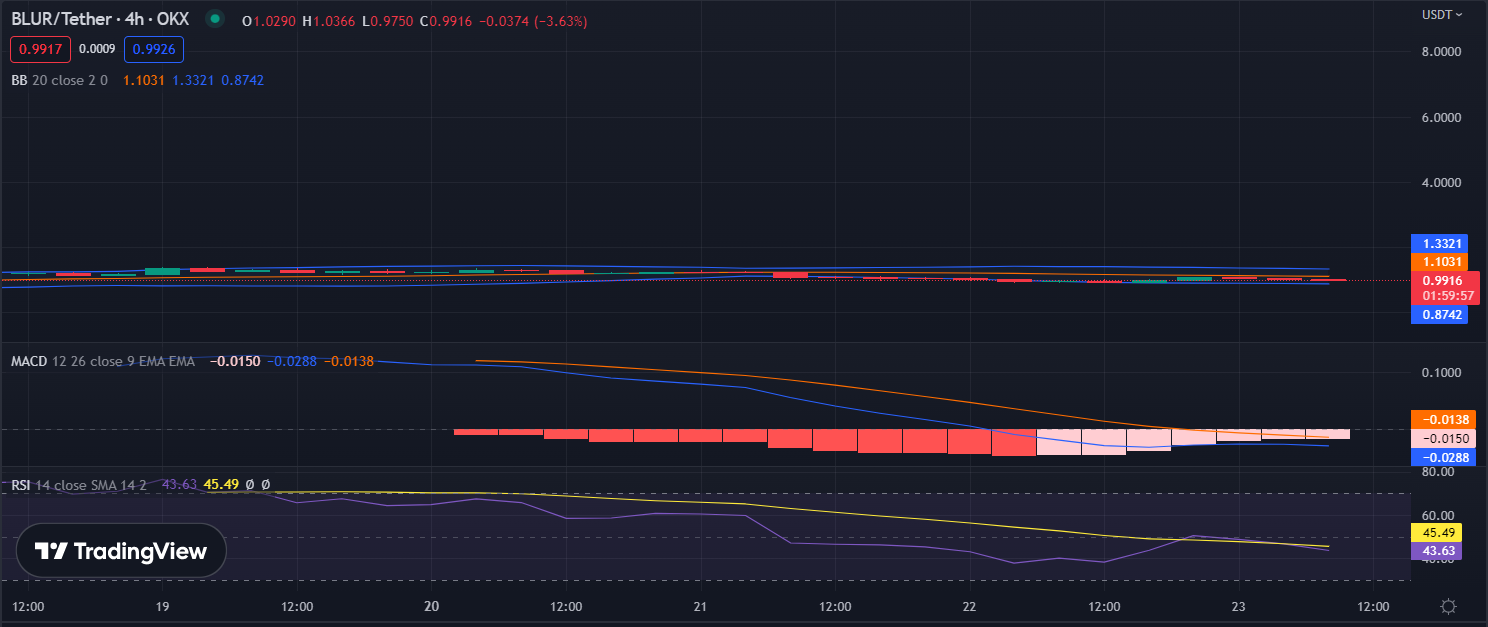
The Bollinger bands on the 4-hour chart show that the market has been relatively stable and will likely stay so in the short term. Also, the BLUR/USDT price is toward the lower arm of the Bollinger band, indicating that selling pressure may prevail in the immediate term. The upper Bollinger band is $1.3321, and the lower band is $0.8744.
On the other hand, the Relative Strength Index (RSI) is at 43.72, indicating a balanced market in terms of buyers and sellers. Nevertheless, the RSI is now trending towards the oversold zone, indicating that the bears are gaining control of market sentiment in the short term.
Meanwhile, the Moving Average Convergence Divergence (MACD) line is at -0.0288, indicating a short-term bearish bias since the MACD signal line is below the MACD line. Ultimately, the 4-hour chart indications suggest that the present market attitude is negative in the short term.

The market sentiment for BLUR/USDT tokens is mixed, with short-term indicators pointing towards bearishness while long-term indicators indicate bullishness.
Disclaimer: In good faith, we disclose our thoughts and opinions in our price analysis, as well as all the facts we give. Each reader is responsible for his or her own investigation. Reader discretion is advised before taking any action.
- SEO Powered Content & PR Distribution. Get Amplified Today.
- Platoblockchain. Web3 Metaverse Intelligence. Knowledge Amplified. Access Here.
- Source: https://investorbites.com/blur-price-analysis-23-02/
- $400 Million
- 1
- 7
- a
- Action
- All
- analysis
- and
- ARM
- attitude
- average
- BAND
- bar
- bearish
- Bears
- before
- below
- between
- bias
- blur
- Bollinger bands
- bull
- Bull Market
- Bullish
- Bulls
- buyers
- Buying
- capitalization
- charge
- Chart
- Consequently
- consistent
- control
- Convergence
- Currency
- demonstrate
- demonstrates
- Disclose
- discretion
- Divergence
- driving
- during
- each
- excellent
- Experiences
- function
- Furthermore
- gaining
- Give
- good
- hand
- High
- higher
- Highs
- hitting
- HOURS
- HTTPS
- immediate
- important
- in
- increased
- index
- indicate
- indications
- Indicators
- internal
- investigation
- Last
- levels
- likely
- Line
- long-term
- Low
- Lows
- MACD
- Market
- Market Capitalization
- Market News
- market sentiment
- max-width
- million
- minimal
- mixed
- Momentum
- move
- moving
- moving average
- negative
- Nevertheless
- news
- Opinions
- Other
- own
- plato
- Plato Data Intelligence
- PlatoData
- prediction
- present
- pressure
- previous
- price
- Price Analysis
- Price Prediction
- purchase
- purchasing
- range
- Reader
- relative strength index
- relatively
- Resistance
- resistance and support
- responsible
- Revealed
- Reveals
- Risen
- rising
- robust
- rsi
- Sellers
- Selling
- sentiment
- Short
- short-term
- show
- Signal
- significant
- Signs
- since
- So
- Source
- specific
- stable
- stablecoin
- stay
- strength
- strengths
- Suggests
- support
- support levels
- taking
- terms
- The
- their
- throughout
- time
- to
- Tokens
- top
- toward
- towards
- trades
- Trading
- trading volume
- TradingView
- trending
- Ultimately
- uptrend
- volatile
- Volatility
- volume
- weakness
- week
- What
- What is
- which
- while
- will
- writing
- zephyrnet


