Published 1 hour ago
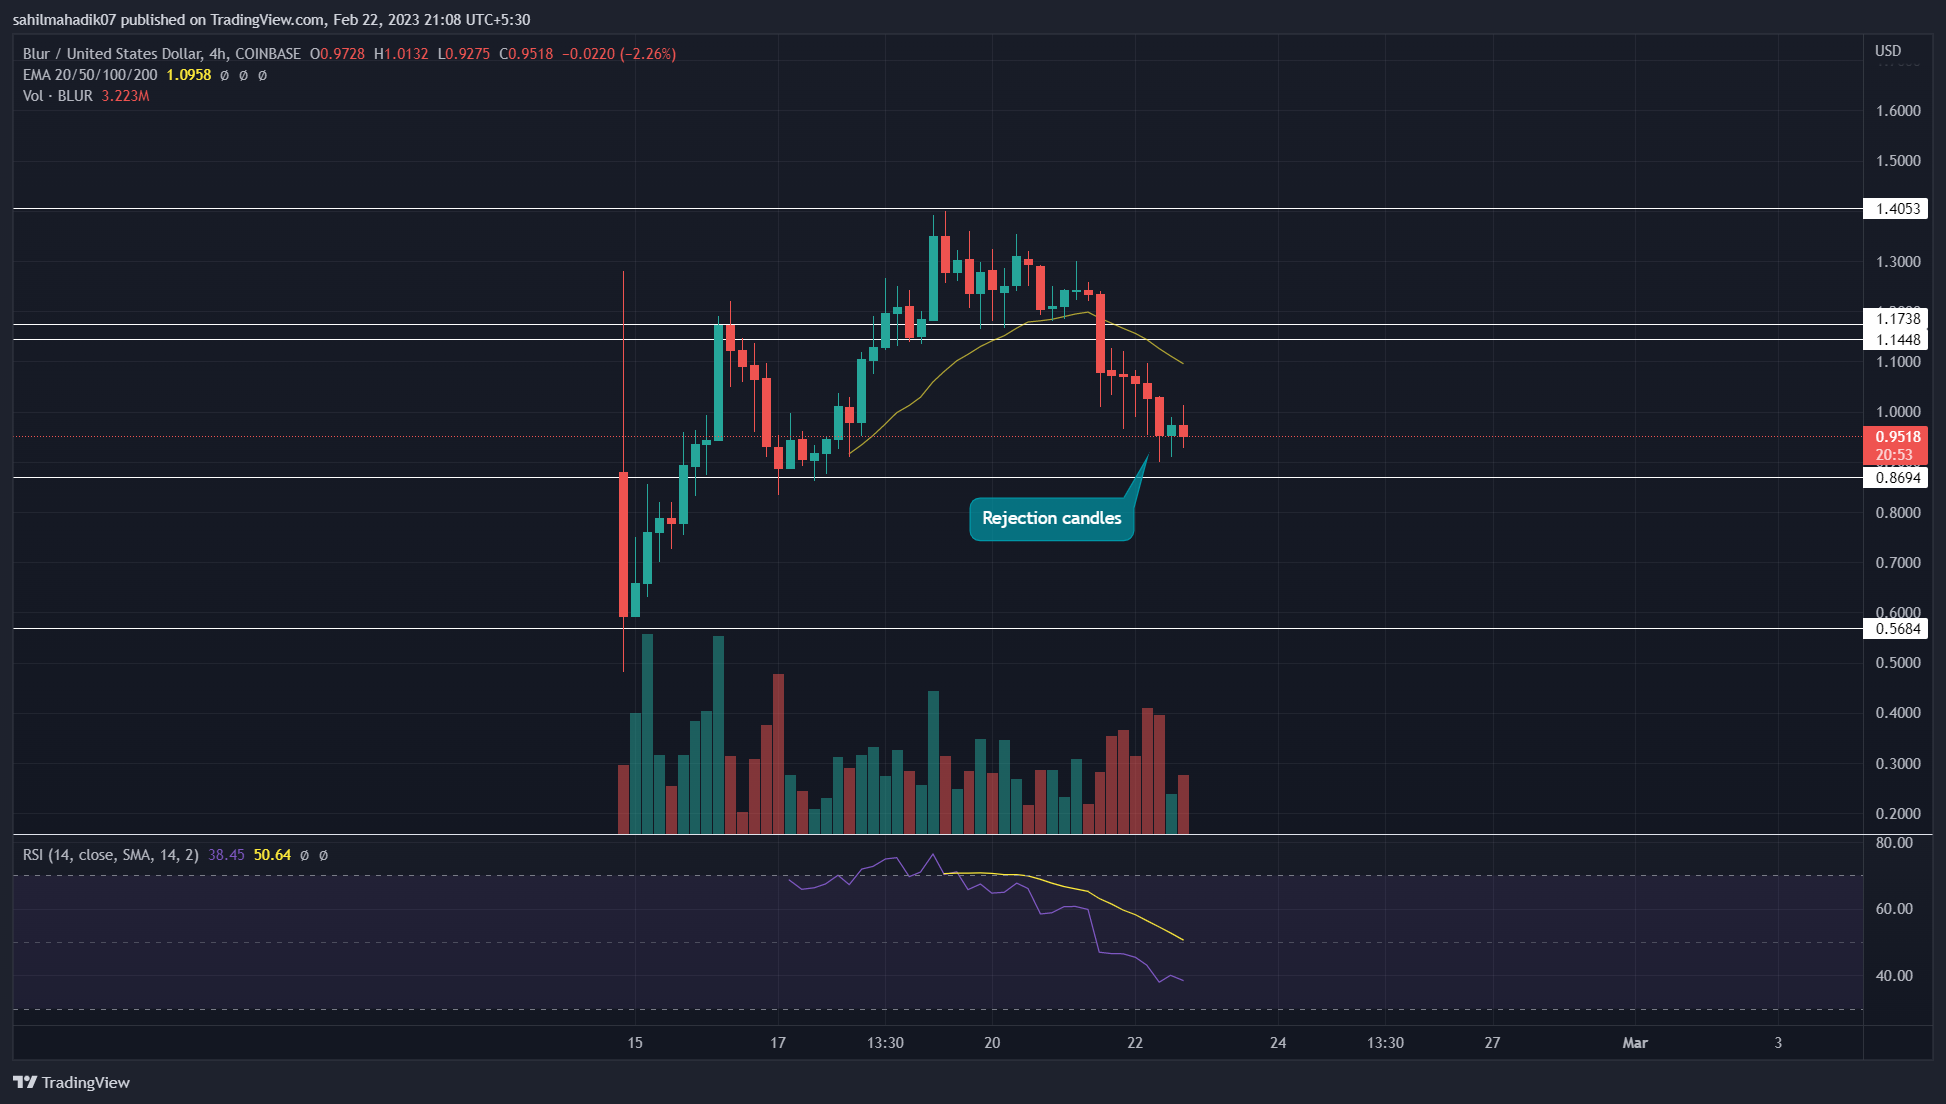
Amid ongoing uncertainty in the crypto market, the BLUR token price turned down from the psychological resistance of $1.4 on February 19th. The bearish reversal triggered a significant correction which tumbled the token below the last swing high resistance of $1.17-$1.14. However, during this downfall, the 4-hour chart showcased several lower price rejection candles indicating the buyers are wrestling to regain trend control.
advertisement
Key Points:
- The four-hour chart displaying multiple long-tail rejection candles suggests a likelihood of a bullish reversal from the $0.88 support level.
- The downsloping 20 EMA may act as a dynamic resistance against the potential price rise.
- The intraday trading volume in Blur is $508.5 Million, indicating an 8.2% gain.

 Source- Tradingview
Over the last five days, the BLUR token price action showcased a V-top reversal from the $1.4 resistance. This pattern is considered a strong bearish reversal signal as it suggests that the bullish trend has lost momentum and the bears have taken control of the price movement.
As a result, the BLUR price tumbled 30% from the $1.4 ceiling and plunged to the current price of $0.96. However, the several lower price rejection candles during this downfall suggest the buyers have not thrown the towel yet.
Trending Stories
These rejection candles indicate a high possibility for the Blur token price to rebound from the $0.88 support and retest the $0.17-0.145 resistance zone as potential resistance. The BLUR holders should keep a close eye on this level as the price behavior around it could influence the token’s near future movement.
Also Read: Top 10 DeFi Lending Platforms In 2023
If the 4-hour candle closes above the $1.17 mark, the buyers could undermine the recent correction and challenge the $1.4.
On a contrary note, a reversal from the $1.17 flipped resistance will project the market sentiment has shifted from buying on dips to selling on rallies. This reversal will hint at a prolonged correction in the Blur token price.
Technical Indicator
EMAs: The daily-RSI slope diving deeper into the bearish terroir indicates growth in underlying bearishness.
advertisement
RSI: The sharp downfall below the midline(50%) indicates the ongoing sentiment in the market is bearish.
Blur token Price Intraday Levels
- Spot rate: $0.95
- Trend: Bearish
- Volatility: High
- Resistance level- $1.17 and $1.4
- Support level- $0.88 and $0.56
Share this article on:
advertisement
The presented content may include the personal opinion of the author and is subject to market condition. Do your market research before investing in cryptocurrencies. The author or the publication does not hold any responsibility for your personal financial loss.
<!– Close Story–>
- SEO Powered Content & PR Distribution. Get Amplified Today.
- Platoblockchain. Web3 Metaverse Intelligence. Knowledge Amplified. Access Here.
- Source: https://coingape.com/markets/blur-price-correction-phase-stalls-at-8-8-support-will-recovery-continue/
- $0.96
- 1
- 10
- 2%
- 7
- 9
- a
- above
- Act
- Action
- Ad
- against
- airdrop
- and
- around
- article
- author
- avatar
- banner
- bearish
- Bears
- Beauty
- before
- below
- blockchain
- blur
- Brian
- Bullish
- buyers
- Buying
- ceiling
- challenge
- Chart
- Close
- Closes
- Coingape
- COM
- condition
- considered
- content
- continue
- contrary
- control
- correction phase
- could
- crypto
- Crypto Market
- cryptocurrencies
- cryptocurrency
- Current
- Days
- deeper
- DeFi
- DeFi lending
- different
- displaying
- down
- downfall
- during
- dynamic
- EMA
- Entertainment
- eye
- Fashion
- February
- finance
- financial
- follow
- from
- future
- Gain
- Growth
- High
- hold
- holders
- However
- HTTPS
- in
- include
- Including
- indicate
- indicates
- influence
- investing
- IT
- journalism
- Keep
- Last
- lending
- Level
- loss
- mark
- Market
- market research
- market sentiment
- million
- Momentum
- movement
- multiple
- Near
- ongoing
- Opinion
- past
- Pattern
- personal
- phase
- Platforms
- plato
- Plato Data Intelligence
- PlatoData
- plugin
- points
- possibility
- potential
- presented
- price
- PRICE ACTION
- price rise
- project
- Publication
- rallies
- Rate
- Read
- rebound
- recent
- recovery
- research
- Resistance
- responsibility
- result
- Reversal
- Rise
- Season
- Selling
- sentiment
- several
- Share
- sharp
- should
- Signal
- significant
- strong
- subject
- Suggests
- support
- support level
- The
- to
- token
- Topics
- Trading
- trading volume
- TradingView
- Trend
- trending
- triggered
- Turned
- Uncertainty
- underlying
- Undermine
- variety
- volume
- which
- will
- working
- written
- years
- Your
- zephyrnet


