Bitcoin (BTC) is following an ascending support line and Ethereum (ETH) has returned to the $1,870 support area.
XRP (XRP) is trading inside a descending parallel channel.
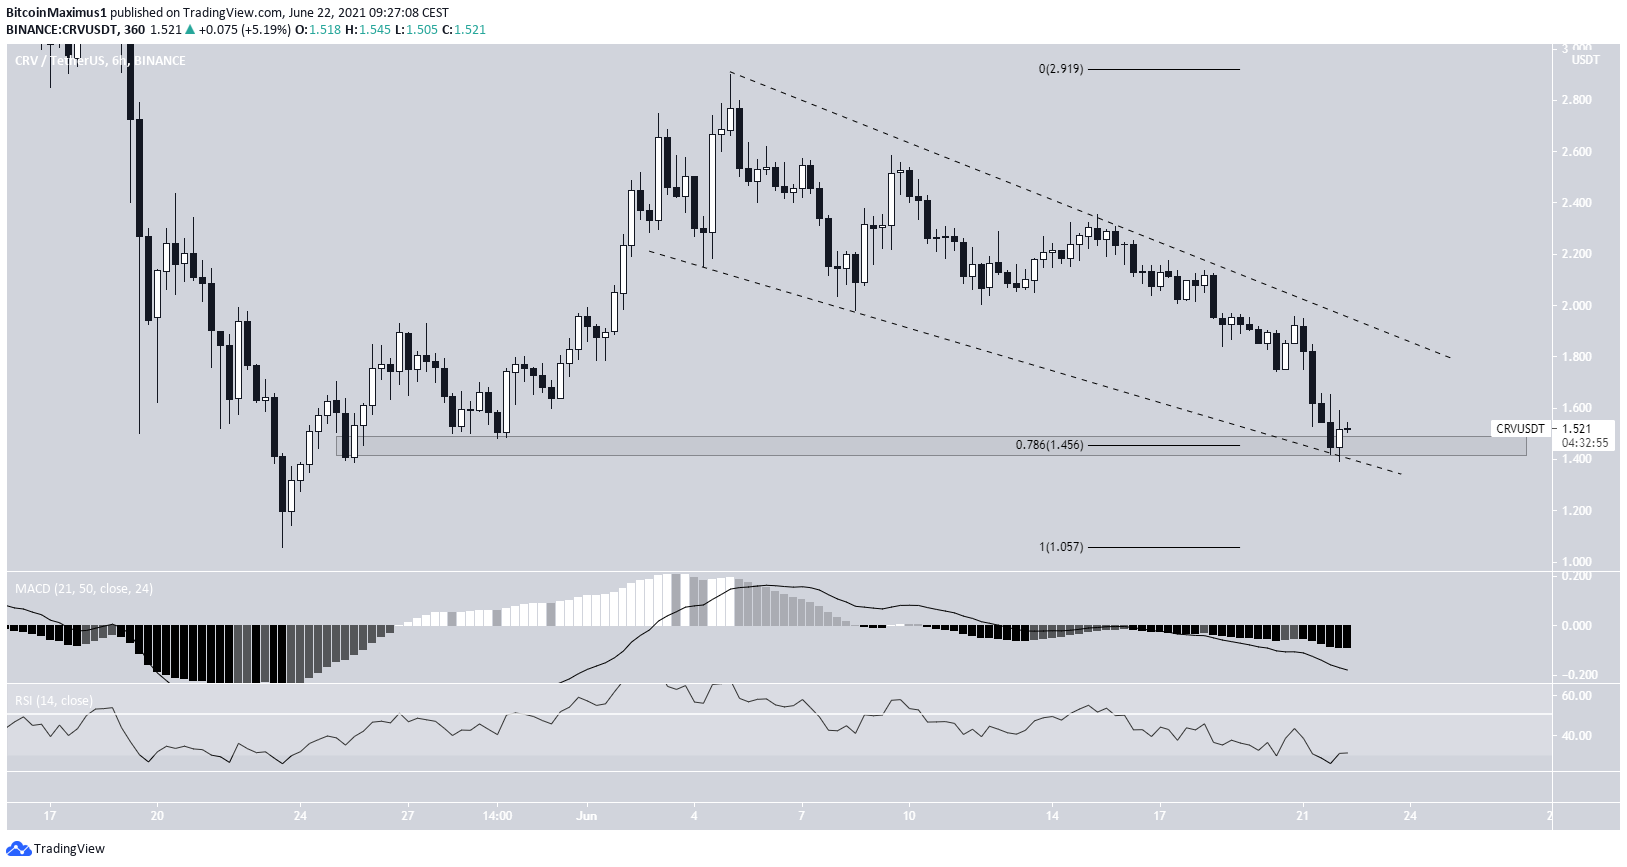
Curve DAO Token (CRV), SushiSwap (SUSHI), and Zcash (ZEC) are trading inside short-term descending wedges.
Decred (DCR) has returned to the $106 support area.
BTC
BTC has been moving downwards since it was rejected by the $41,150 area on June 15. So far, it’s reached a local low of $31,163 on June 22.
The low was made at a potential ascending support line, touching it for the third time.
However, technical indicators are bearish. The RSI has fallen below 50 and the Stochastic oscillator is decreasing. The MACD histogram is almost negative and the signal line has already turned negative.
However, there is some bullish divergence in the RSI, indicative of a potential short-term bounce. Despite this, it seems that the longer-term trend is bearish.

ETH
ETH has been moving downwards since May 26 after reaching a local high of $2,913. On June 21, it broke down from a descending wedge and fell sharply all the way to the $1,860 support area.
The price rebounded once it reached horizontal support. The support line of the wedge near $2,050 is expected to act as resistance now. However, there are no bullish reversal signs in place, suggesting that an eventual breakdown is likely.
If one occurs, the next support area would likely be found at $1,600.

XRP
XRP has been falling sharply since May 18. It initiated an upward move on May 23 but was short-lived. XRP has decreased considerably over the past three days, reaching a low of $0.57 on June 22.
The low was made at the support line of a descending parallel channel and the $0.60 horizontal support area.
Despite this, there are no bullish reversal signs in place that would indicate a long-term bullish reversal.
If a short-term bounce occurs, the $0.79 area is likely to act as resistance.

CRV
CRV began an upward move on May 23, which eventually led to a high of $2.90 on June 5. However, CRV has been moving downwards since, potentially trading inside a descending wedge.
Today, it reached the support line of the wedge and bounced. The line also coincides with the 0.786 Fib retracement support level.
However, there are no bullish reversal signs to confirm a reversal.
A breakdown below this line would likely take CRV back to the $1.05 lows.

ZEC
ZEC bounced on May 23, initiating a six-day upward move that culminated with a high of $186.86. However, it has been falling since.
Similar to CRV, ZEC also seems to be trading inside a short-term descending wedge.
The current price level coincides with both the support line of a wedge and the $100 horizontal support level. Despite this, there are no bullish reversal signs in place.
A breakdown below this level could trigger a sharp fall.

SUSHI
On May 23, SUSHI began an upward movement that continued until June 3. Since then, it has been trading inside a descending wedge, similarly to CRV and ZEC.
However, both the RSI and MACD have generated a bullish divergence — a potential sign of a potential bullish reversal.
Therefore, a breakout from the wedge would be likely. In that case, the $10.06-$10.90 area would be expected to act as resistance.

DCR
DCR has been moving downwards since June 1, after reaching a high of $177. So far, it has reached a low of $101.82 on June 22.
The low was made inside the $105 support area. Afterward, DCR immediately created a bullish engulfing candlestick.
In addition, the RSI has generated a bullish divergence, an occurrence that often precedes a rebound. If it does bounce back, the $125 area would be expected to act as resistance.

For BeInCrypto’s latest bitcoin (BTC) analysis, click here.
Disclaimer
All the information contained on our website is published in good faith and for general information purposes only. Any action the reader takes upon the information found on our website is strictly at their own risk.
Source: https://beincrypto.com/btc-eth-xrp-crv-zec-sushi-dcr-technical-analysis-june-22/
- 2019
- Action
- All
- analysis
- AREA
- barcelona
- bearish
- breakout
- BTC
- Bullish
- CRV
- cryptocurrencies
- cryptocurrency
- Current
- DAO
- data
- Development
- Drop
- Economic
- Economics
- ETH
- financial
- Focus
- General
- good
- graduate
- here
- High
- HTTPS
- information
- IT
- Led
- Level
- Line
- local
- Markets
- move
- Near
- price
- Reader
- Risk
- School
- Signs
- So
- support
- support level
- Technical
- Technical Analysis
- time
- token
- trader
- Trading
- Website
- xrp
- ZEC


