Bitcoin (BTC) has created a bullish engulfing candlestick.
Ethereum (ETH) has completed a corrective structure.
XRP (XRP) is following a descending support line.
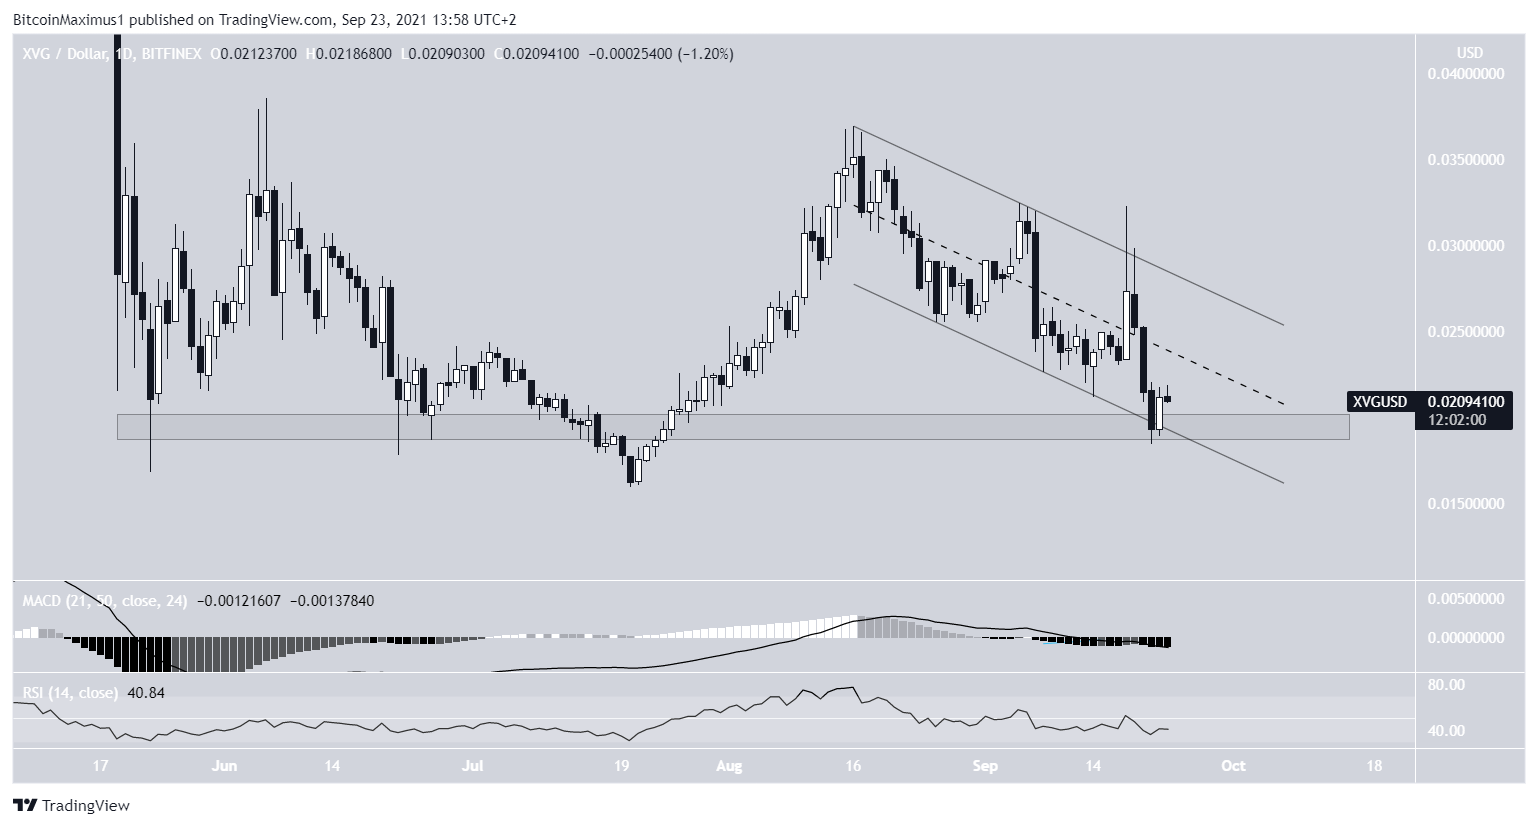
Verge (XVG) has returned to the $0.19 support area.
Terra (LUNA) is facing resistance at $34.
Elrond (EGLD) is following an ascending support line.
FTX Token (FTT) reached a new all-time high on Sept 9.
BTC
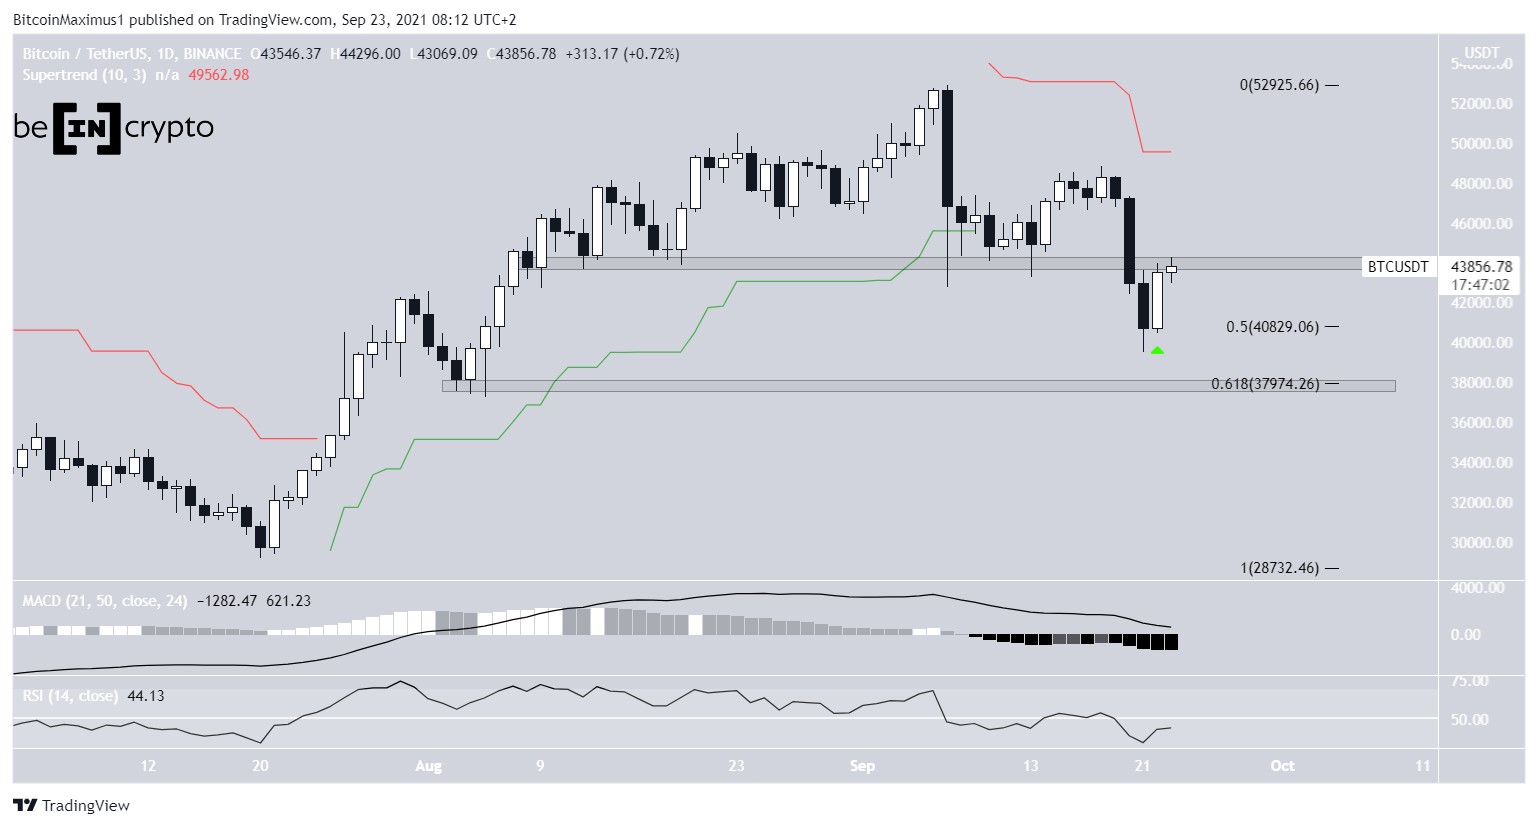
On Sept 22, BTC bounced considerably and created a bullish engulfing candlestick in the process. The bounce validated the $40,820 area as support. This is the 0.5 Fib retracement support level.
However, BTC is now facing resistance at $44,000, the area which previously acted as support.
Furthermore, technical indicators are bearish. The Supertrend is bearish and the MACD and RSI are both falling.
Therefore, until this area is reclaimed, the trend cannot be considered bullish.
ETH
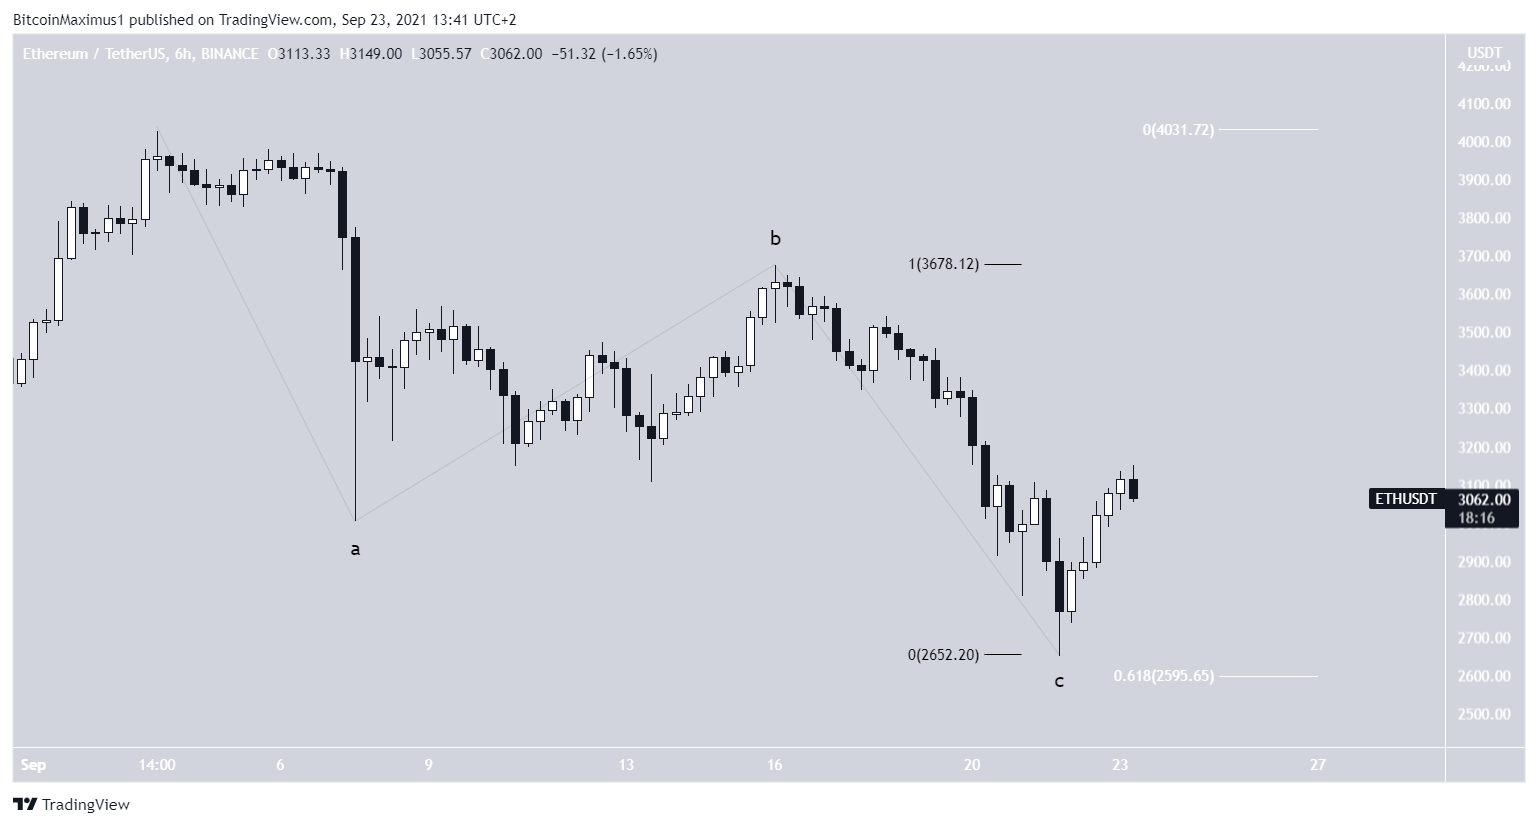
ETH has been falling since Sept 3, when it reached a high of $4,027. So far, it has made a low of $2,652, doing so on Sept 16.
The low was made very close to the 0.618 Fib retracement level (white) at $2,595. Furthermore, it gave waves A:C an exactly 1:1 ratio (black).
Therefore, it is possible that the correction for ETH is complete, and the token will now move higher.
XRP
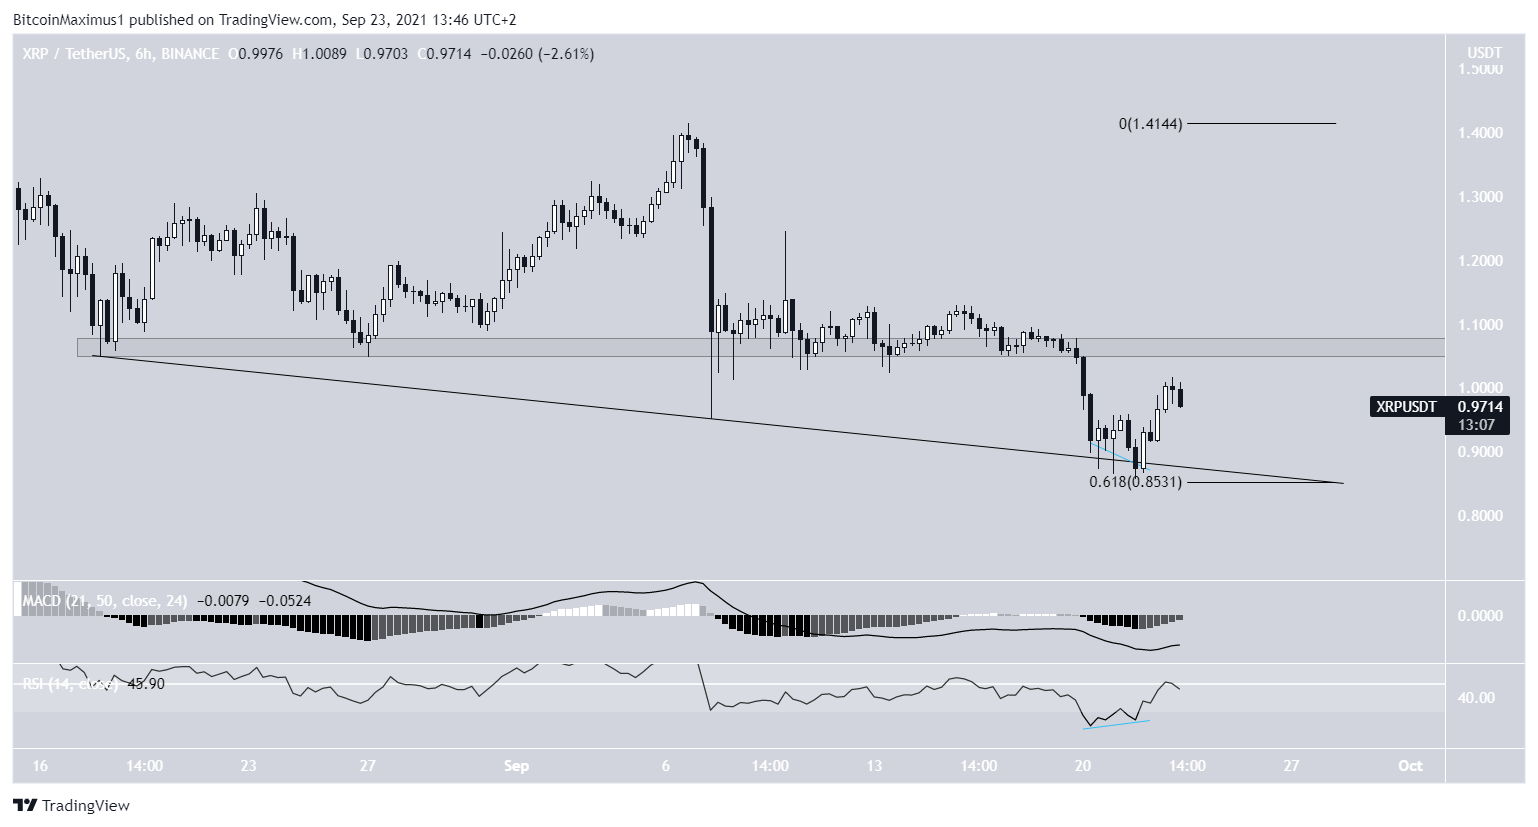
On Sept 22, XRP bounced after reaching a descending support line which had been in place since Aug 16. At the time, the line coincides with the 0.618 Fib retracement support level. The bounce was preceded by bullish divergence in the RSI, in addition to this, the MACD is moving upwards.
However, there is very strong resistance at $1.05, created by the previous horizontal support area. Until the area is reclaimed, the trend cannot be considered bullish.
XVG
XVG has been decreasing since Aug 16. The decrease has taken the shape of a descending channel, which is usually a corrective movement.
On Sept 21, the token reached a low of $0.0185. The low was made at the $0.19 horizontal support area, which has been in place since May.
However, despite the bounce at support, technical indicators do not yet provide any bullish signs, since both the RSI and MACD are falling.
LUNA
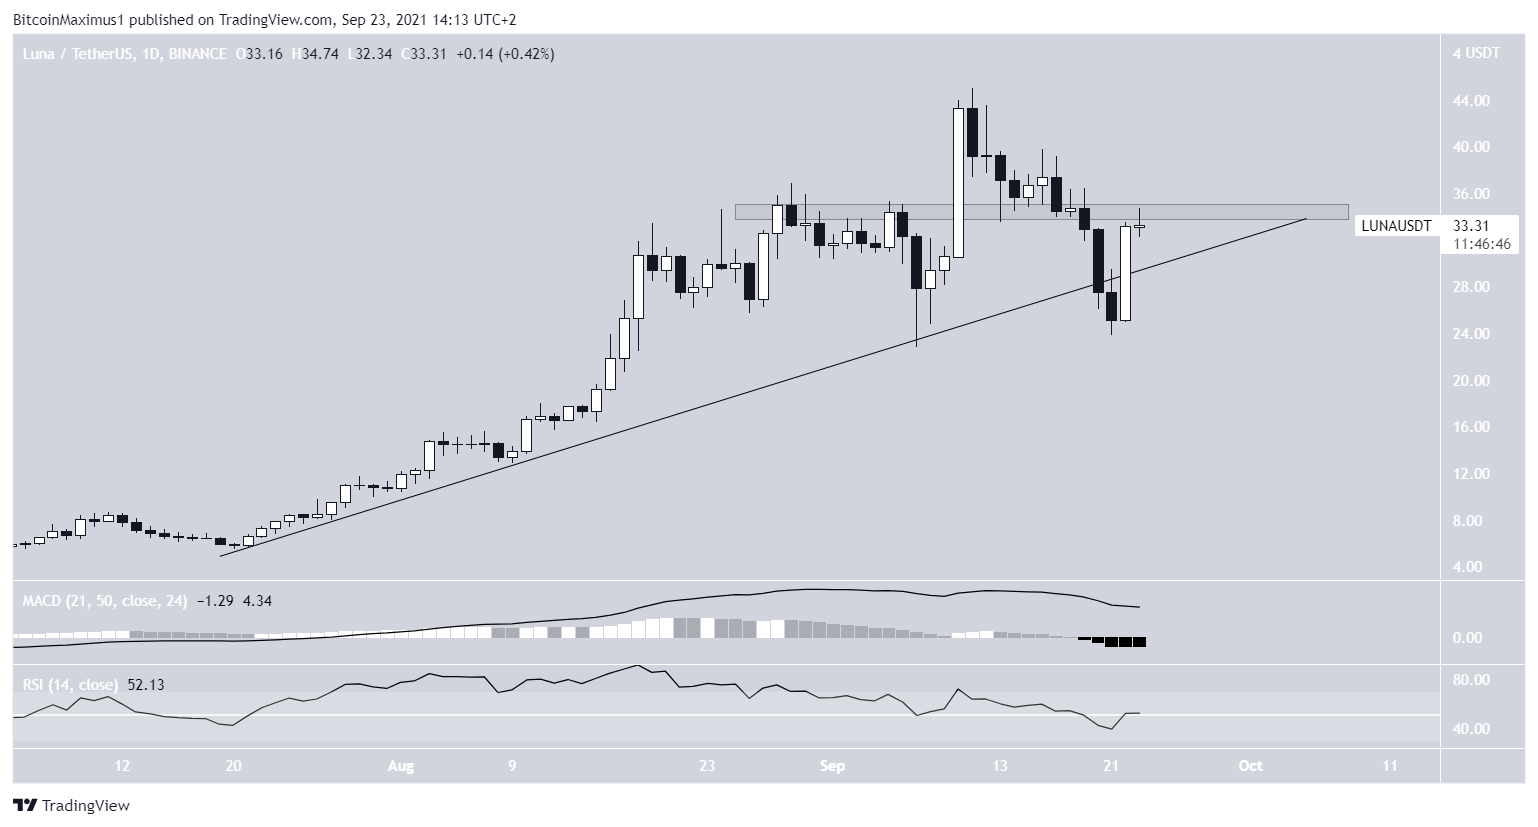
LUNA has been increasing alongside an ascending support line since July 20. This led to a new all-time high price of $45 on Sept 11.
However, a downward movement followed afterwards, leading to a low of $23.95.
While it initially seemed that this caused a breakdown from the aforementioned support line, the ensuing bounce reclaimed it.
However, LUNA is still facing resistance from the $34 horizontal area. Furthermore, technical indicators are bearish, since both the RSI and MACD are falling.
Therefore, the trend cannot be considered bullish until the $34 area is reclaimed.
EGLD
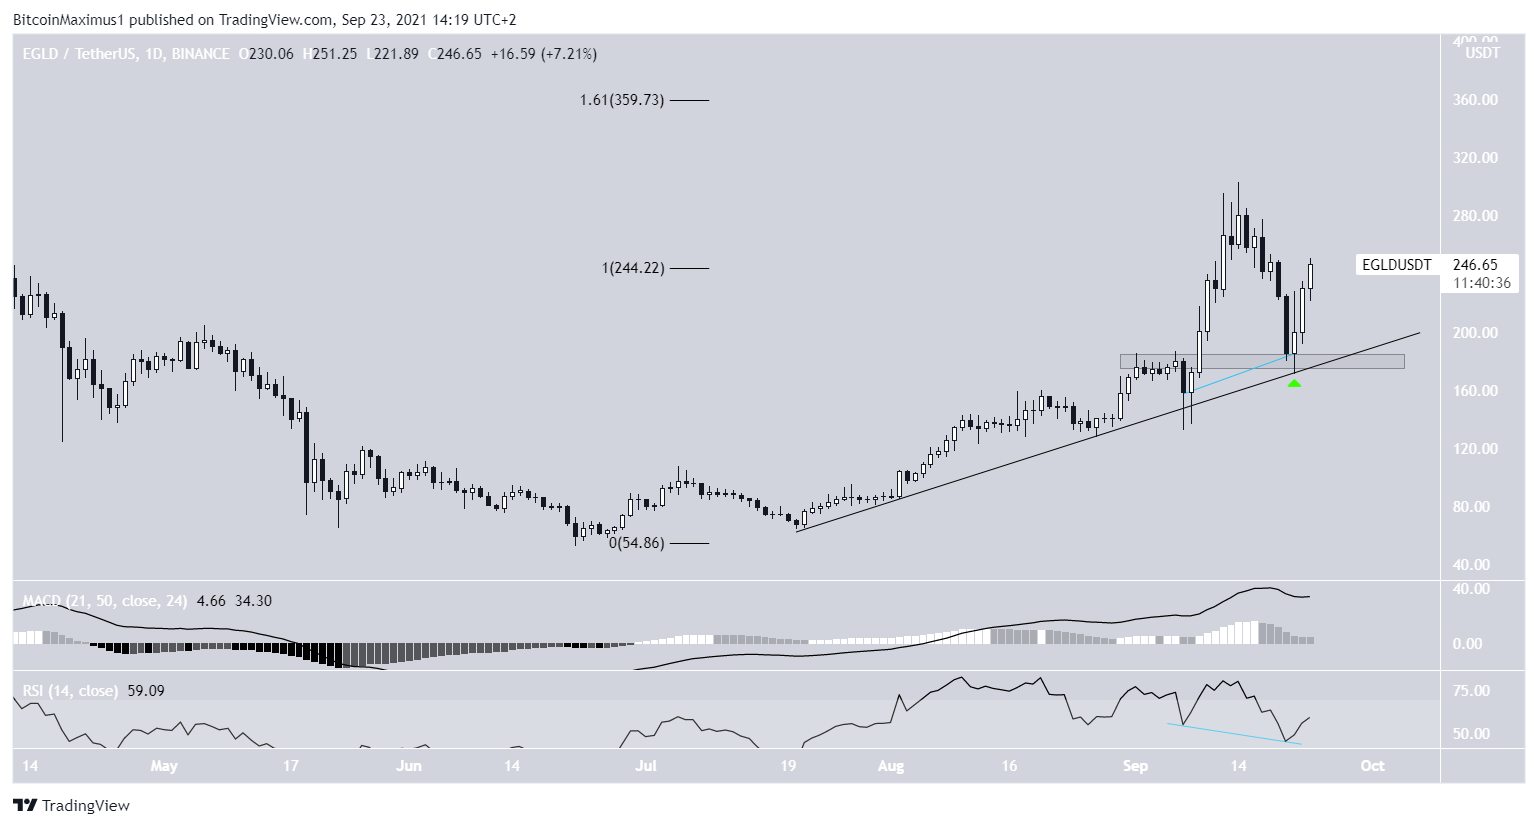
EGLD has been following an ascending support lien since July 20. After a bounce on Sept 8, the rate of increase accelerated, leading to a new all-time high of $303 on Sept 14.
EGLD dropped afterwards, but bounced at the confluence of the ascending support line and $180 horizontal area (green icon). In addition to this, the RSI generated hidden bullish divergence. The token has been moving upwards since.
Using an external Fib retracement on the previous drop, the next resistance area is determined to be at $360 (black).
FTT
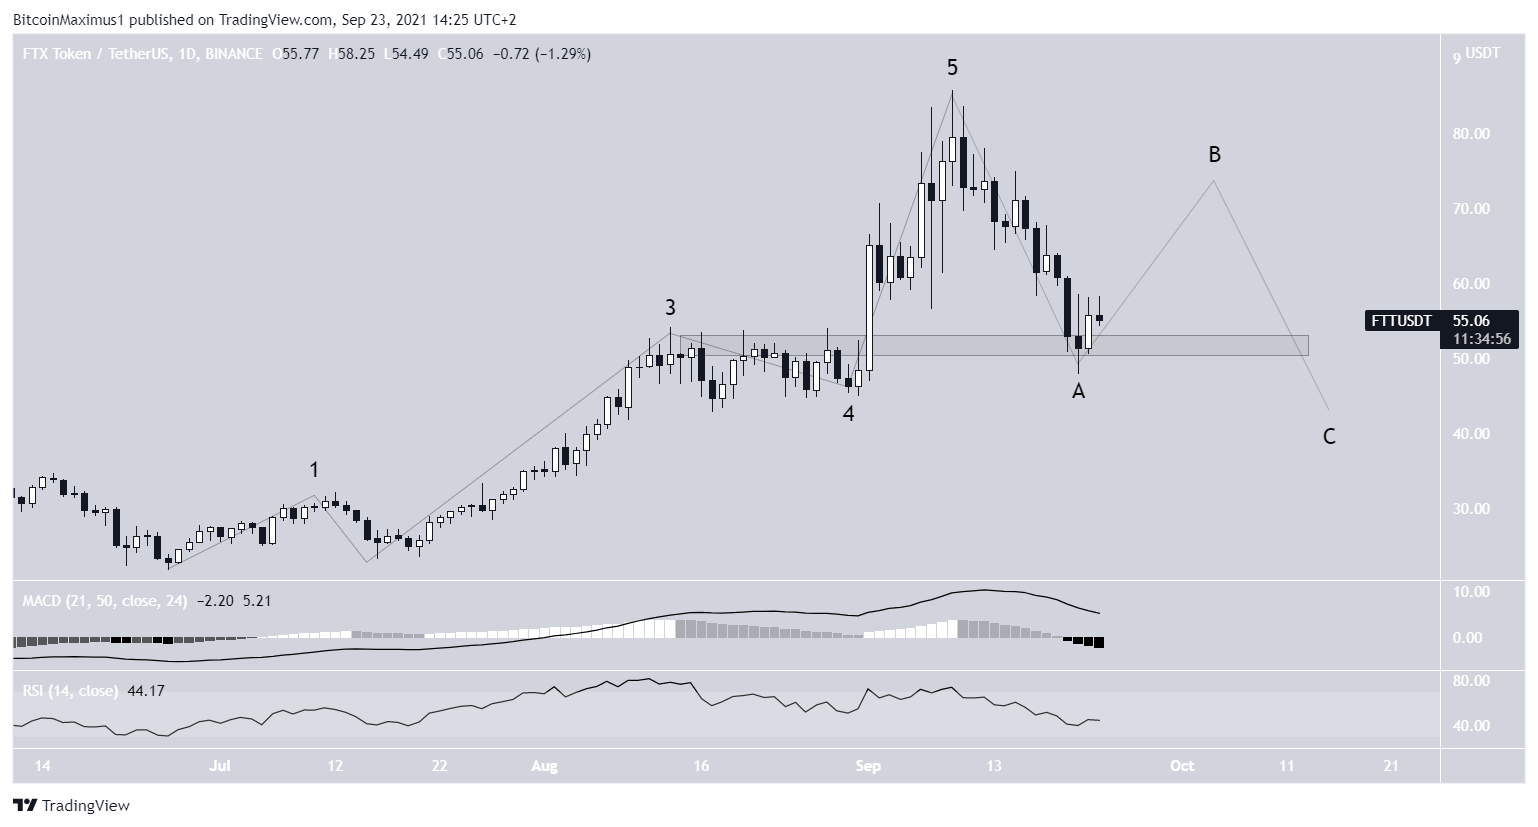
FTT has been falling since Sept 9, when it reached an all-time high of $85.74. The upward movement that led to the high looks like a completed five wave bullish impulse.
After the ensuing drop, the token seemingly found support at $50, initiating a bounce.
However, the RSI and MACD are both bearish and the bounce has been weak so far.
It is possible that this is only wave A of an A-B-C corrective structure.
For BeInCrypto’s latest Bitcoin (BTC) analysis, click here.
What do you think about this subject? Write to us and tell us!
Disclaimer
All the information contained on our website is published in good faith and for general information purposes only. Any action the reader takes upon the information found on our website is strictly at their own risk.
Source: https://beincrypto.com/btc-eth-xrp-xvg-luna-egld-ftt-technical-analysis-sept-23/
- 000
- 11
- 9
- Action
- All
- analysis
- analyst
- AREA
- barcelona
- bearish
- Black
- BTC
- Bullish
- caused
- cryptocurrencies
- cryptocurrency
- data
- discovered
- Drop
- dropped
- Economics
- ETH
- facing
- financial
- General
- good
- graduate
- Green
- High
- HTTPS
- ICON
- Increase
- information
- IT
- July
- leading
- Led
- Level
- Line
- Markets
- move
- price
- Reader
- Risk
- School
- Signs
- So
- support
- support level
- Technical
- Technical Analysis
- time
- token
- us
- Wave
- waves
- Website
- websites
- writing
- xrp
- youtube


