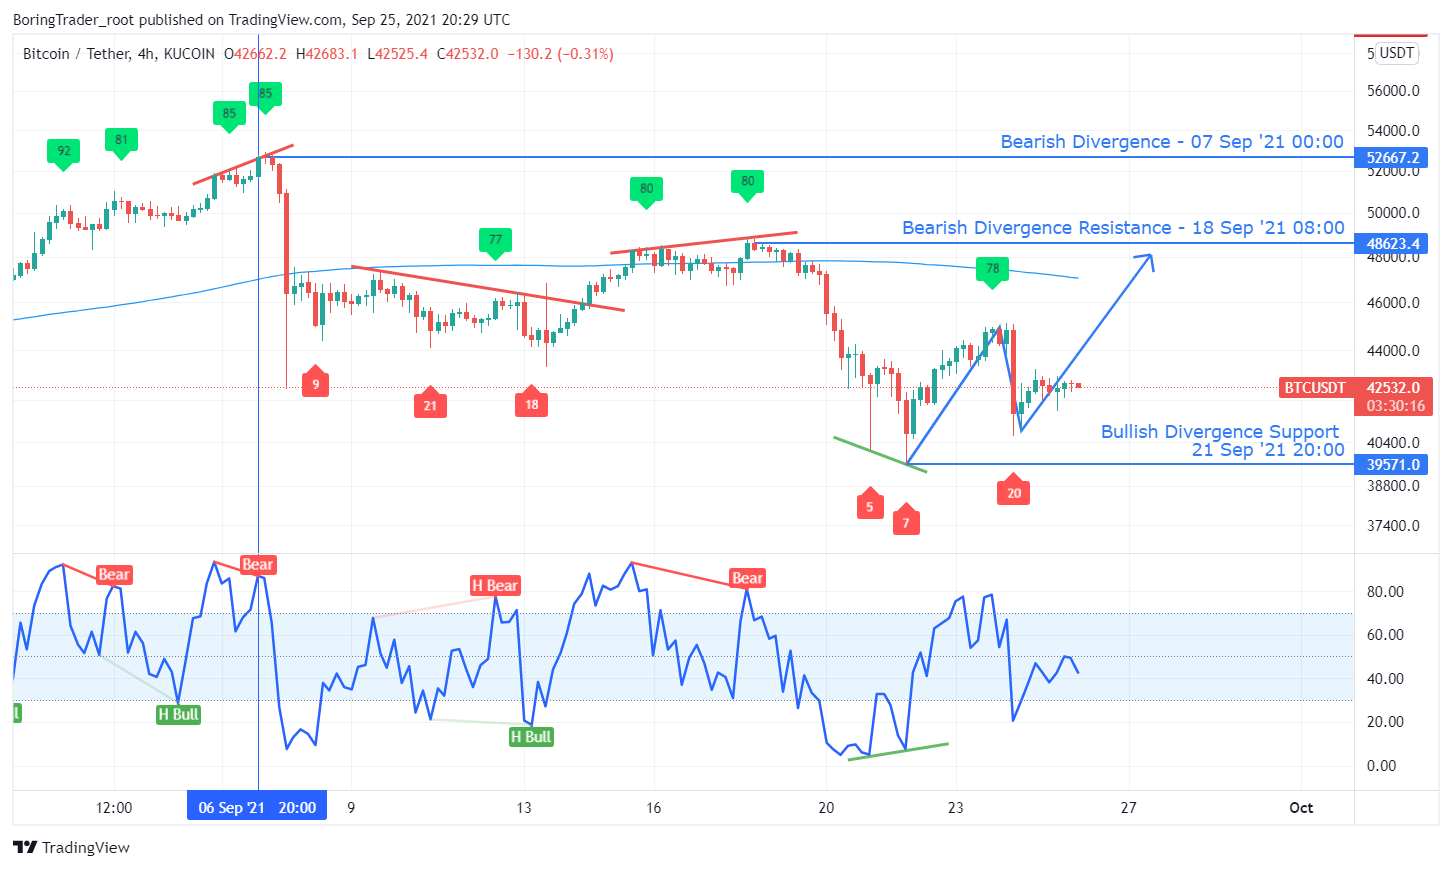
The recent bearish statement by the People’s Bank of China labeling all cryptocurrency related transactions as illegal followed by a decline in Bitcoin-Blockchain Miners’ revenue [BCHAIN/MIREV] suggests the recent slump in the Bitcoin BTC price.
Earlier this month, the BTCUSDT crypto pair traded above the 200-period Moving Average on the H4 time frame as shown above.
BTCUSDT 4 Hr Chart

As early buyers scamper to exit their positions following the regular bearish divergence on the H4 time frame, the BTC price plummets by roughly 19%, signaling a switch to a bearish trend.
The RSI [4] on the daily time frame traded above level-25 for 44 days and for the first time, slumped below the level on 05 September, indicating a change in trend triggered by the bearish divergence setup mentioned earlier.
The daily time frame dictates the trend bias of the BTCUSD at the moment, while the H4 time frame signals entry levels with overbought or oversold.
At this point, the overbought level of the H4 time frame and bearish divergence setups now serves as entry into the newly formed downtrend. An attempt by the bulls to force the price above 14 September bearish divergence trend line [H4 time frame] gave in to another bearish divergence pattern on 18 September, which again caused the BTC price to nosedive by another 18%.
Recently, the bulls now have a support level established at the $39571.00 mark. Further price close below this level indicates a strong presence of the bears. Conversely, a price close above the 24 September resistance [44978.40], and a close above the MA200 should confirm the long-awaited upbeat trend.
Most importantly, the RSI [4] value above level-75 on the daily time frame confirms the current mid-term bearish trend of the BTCUSDT.
Bitcoin BTC Intraday Levels
- Spot rate: 42572.80
- Mid – Term Trend [H4]: Bearish bias
- Volatility: Low
- Support: $39,571.00 and $40,683.00
- Resistance: $52667.20, $48,623.4 and $44978.40
- All
- analysis
- Bank
- Bank of China
- bearish
- Bears
- Bitcoin
- Bitcoin BTC
- Bitcoin Price
- Bitcoin Price Analysis
- BTC
- btc price
- BTCUSD
- BTCUSDT
- Bulls
- caused
- change
- China
- content
- crypto
- cryptocurrencies
- cryptocurrency
- Current
- Early
- Exit
- financial
- First
- first time
- hold
- hr
- HTTPS
- Illegal
- investing
- labeling
- Level
- Leverage
- Line
- mark
- Market
- market research
- Opinion
- Pattern
- People’s Bank Of China
- price
- Price Analysis
- research
- revenue
- Scale
- Share
- Statement
- support
- support level
- Switch
- time
- Transactions
- value


