TL;DR Breakdown
- Chainlink price analysis is bullish.
- Resistance for LINK is present at $13.9.
- Support for cryptocurrency is present at $12.5.
The latest Chainlink price analysis confirms a bullish trend for the day as the buying momentum has been continuously growing today. In the past week, the market seemed to be under the influence of sellers as the price levels were sinking. But today, the trend has shifted as the price experienced an increase up to $13.5 during the day. This came as a relief for the buyers as the bears were and are still in the dominating position overall.
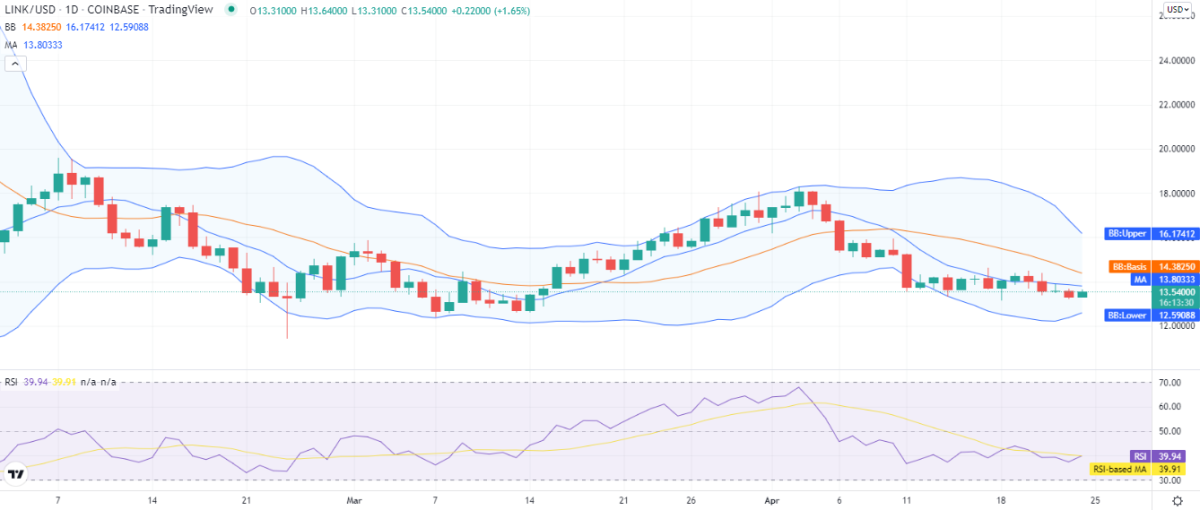
LINK/USD 1-day price chart: Bullish turn disrupts bearish wave as price draws back to $13.5
The daily Chainlink price analysis confirms a bullish trend for the market as the price covered an upward movement in the past 24-hours. The sellers controlled the market in the past week as a bearish wave was expanding. But today, an unexpected increase was experienced by the cryptocurrency as its value moved up to a $13.5 lower high. Still, it is way lower than its moving average (MA) value, which is standing at a $13.8 position. The gain is also minimal as it amounts to only 0.31 percent for the last 24 hours, and the trading volume is also down by more than 35 percent for today.

As the area between the Bollinger bands is decreasing, the upcoming price events are much more likely to be bearish, which is discouraging news so far as the price oscillations are already low. The upper band shows a $16.1 value, representing the resistance, and the lower band displays a $12.5 value representing the strongest support. The SMA 20 curve is trading below the SMA 50 curve, as the bears are in dominating position so far. The relative strength index (RSI) is trading at an upwards slope at index 39, hinting at the buying activity in the market.
Chainlink price analysis: Recent developments and further technical indications
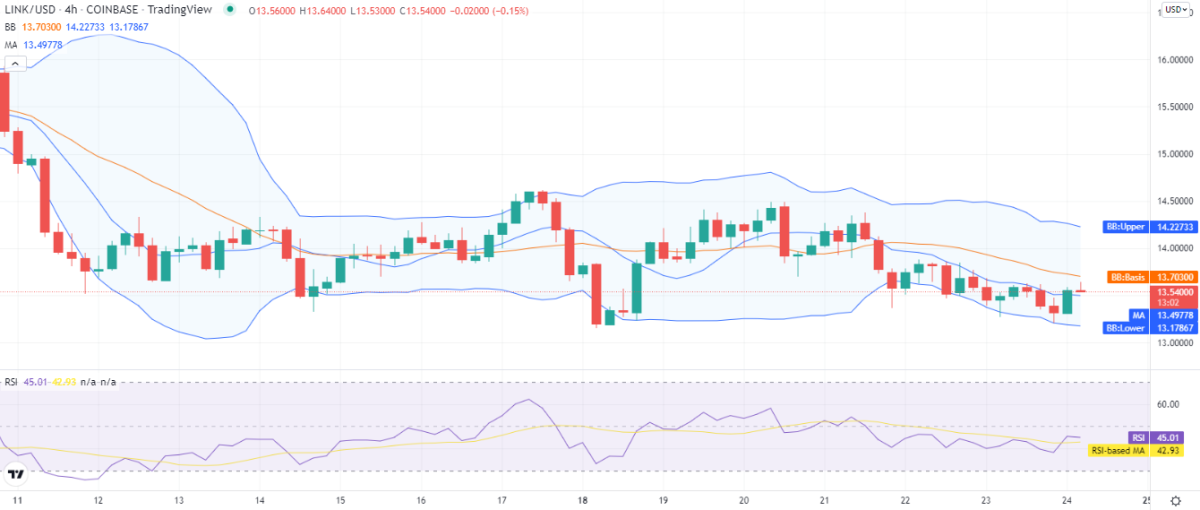
The four-hour Chainlink price analysis supports the buyers as the price experienced a good increase in price in the first four hours of today’s trading session. This is because the bulls have made a comeback and are striving hard to win back their lead. The buying momentum was gaining strength when the selling pressure appeared again, which is why the coin value leveled down to $13.5 in the last four hours. However, the correction seems to be controlled up till now.

The correction is expected to end soon, and the upward trend is expected to be extended further in the next few hours. The Bollinger bands indicator shows low volatility, which is making an average of $13.7. At the same time, its upper band shows a value of $14.2, and its lower band displays a value of $13.1, thus providing a margin of one dollar for the price movement. The Relative Strength Index (RSI) graph shows a bearish curve as the score just dropped down to index 45, but the indicator’s reading improved substantially at the start of the day.
The past few months proved highly unprofitable for the cryptocurrency, as overall, the bears seemed to be on the dominating edge. This is why the technical indicators for LINK/USD display a bearish signal. There are 15 indicators on the selling side, eight on the neutral, whereas only three indicators support the buying side.
Chainlink price analysis conclusion
The above one-day and four-hour Chainlink price analysis are going in favor of the bulls today. The cryptocurrency faced a substantial amount of loss in the past days as the price levels receded constantly. A different trend was observed during the past few hours where the bulls showed an overpowering strength which is a good sign for intraday trading.
Disclaimer. The information provided is not trading advice. Cryptopolitan.com holds no liability for any investments made based on the information provided on this page. We strongly recommend independent research and/or consultation with a qualified professional before making any investment decisions.
- "
- 39
- 7
- 9
- activity
- advice
- already
- amount
- amounts
- analysis
- AREA
- average
- bearish
- Bears
- Bullish
- Bulls
- buyers
- Buying
- Chainlink
- Coin
- cryptocurrency
- curve
- day
- developments
- different
- Display
- displays
- Dollar
- down
- dropped
- Edge
- events
- expanding
- expected
- experienced
- faced
- First
- further
- going
- good
- Growing
- High
- highly
- holds
- HTTPS
- improved
- Increase
- index
- influence
- information
- investment
- Investments
- IT
- latest
- lead
- liability
- likely
- LINK
- LINKUSD
- made
- Making
- Market
- Momentum
- months
- more
- movement
- moving
- news
- percent
- position
- present
- pressure
- price
- Price Analysis
- professional
- providing
- qualified
- Reading
- recommend
- relief
- representing
- research
- Sellers
- So
- start
- substantial
- support
- Supports
- Technical
- time
- today
- Trading
- upcoming
- value
- Volatility
- volume
- Wave
- week
- win


