Chainlink price analysis for today is indicating a positive trend. Chainlink (LINK) has had a great bullish run over the last 24 hours. The coin is currently trading at $8.46 and is up by 11.36 percent. The market capitalization of the coin has also reached $3.9 billion while the 24-hour trading volume of the coin has also increased and is currently at $899,862,865.33. The coin started the day at $7.62 and reached a high of $8.46. The bulls have been able to push the prices higher and are currently facing resistance at $9.
Chainlink price action on a daily chart: LINK gains momentum at $8.43
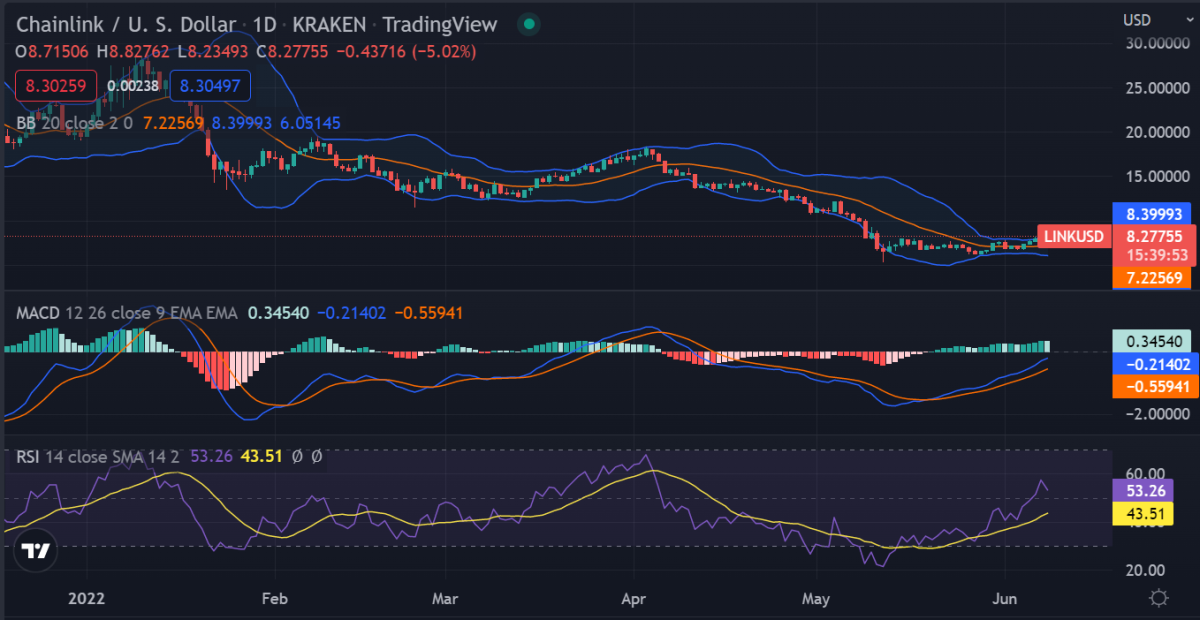
The one-day Chainlink price analysis shows LINK price is going on the bullish side as the LINK prices are approaching $8.46 after a successive bullish streak. For now, the buyers seem to be in control as they pushed the prices higher from $7.62 to $8.46. The current market conditions are in favor of the bulls as the RSI indicator is well above the 60 levels and is currently trading at 64.65. The MACD indicator is also in the bullish zone as the signal line is well above the histogram.

The moving averages are also indicating a bullish trend as the 50-day MA is well above the 200-day MA. The immediate support for the coin lies at $8.20 and $8.00. The resistance levels are at $9.00 and $9.20.The volatility is currently starting to increase, and the Bollinger bands’ values are currently starting to widen, and this is a sign that the prices may see some volatile price action in the near future.
Chainlink price analysis on a 4-hour price chart: LINK nears $8.5
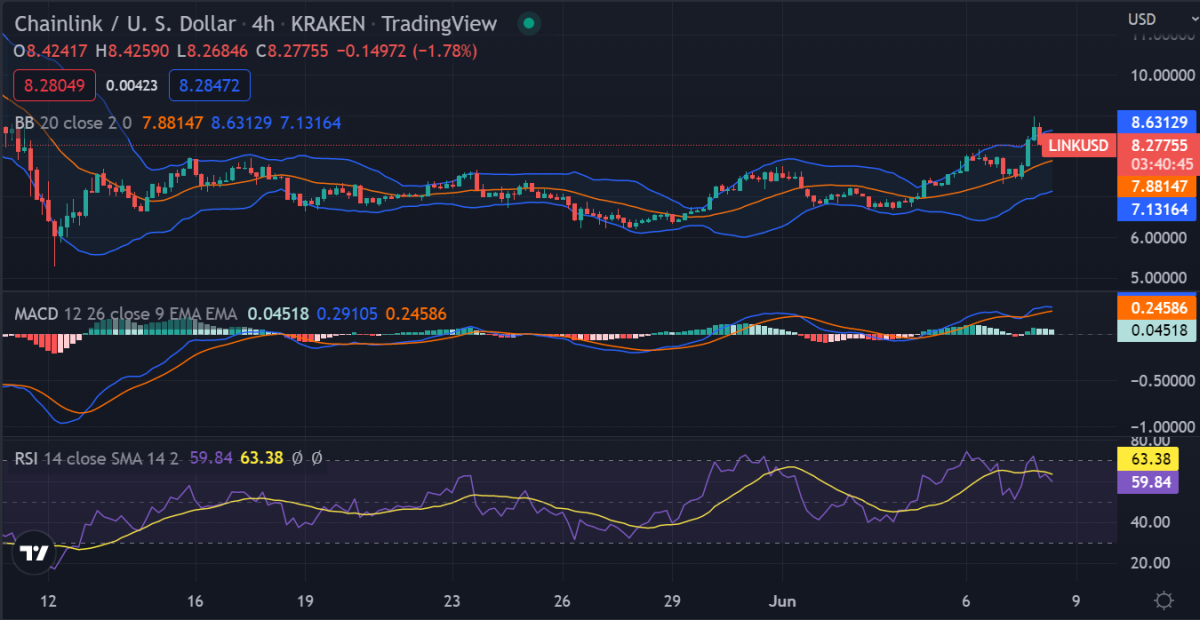
The 4-hour Chainlink price chart is also going on the bullish side as the prices are trading well above the moving averages. The 50-day MA is well above the 200-day MA, which is a sign that the trend is in favor of the bulls. The MACD indicator is also in the bullish zone, and the RSI indicator is also well above 60 levels. The immediate support lies at $8.20 and $8.00 while the resistance levels are at $9.00 and $9.20.

The Bollinger bands’ values are currently widening, which is a sign of increased volatility in the prices. Overall, the trend is in favor of the bulls, and the prices may soon test the $9.00 resistance levels. Moreover, the upper band has moved above the price, which is a bullish sign. Also, as per the Fibonacci retracement levels, the coin may find support at $8.22.
Chainlink price analysis conclusion
Chainlink price analysis shows that the trend is in favor of the bulls as they pushed the prices higher from $7.62 to $8.46. The current market condition is expected to continue in the near future, and the prices may soon test the $9.00 resistance levels. However, the volatile price action cannot be ruled out as the Bollinger bands’ values are currently widening.
Disclaimer. The information provided is not trading advice. Cryptopolitan.com holds no liability for any investments made based on the information provided on this page. We strongly recommend independent research and/or consultation with a qualified professional before making any investment decisions.
- $3
- $899
- 11
- 9
- Action
- advice
- analysis
- before
- Billion
- Bullish
- Bulls
- buyers
- capitalization
- Chainlink
- chainlink (link)
- Coin
- condition
- conditions
- continue
- control
- Current
- Currently
- day
- decisions
- expected
- facing
- future
- going
- great
- High
- higher
- holds
- However
- HTTPS
- image
- immediate
- Increase
- increased
- information
- investment
- Investments
- levels
- liability
- Line
- LINK
- made
- Making
- Market
- Market Capitalization
- Momentum
- moving
- Near
- overall
- percent
- positive
- price
- Price Analysis
- professional
- qualified
- recommend
- research
- Run
- sign
- some
- started
- support
- test
- The
- today
- Trading
- Volatility
- volume
- while


