Published 31 mins ago
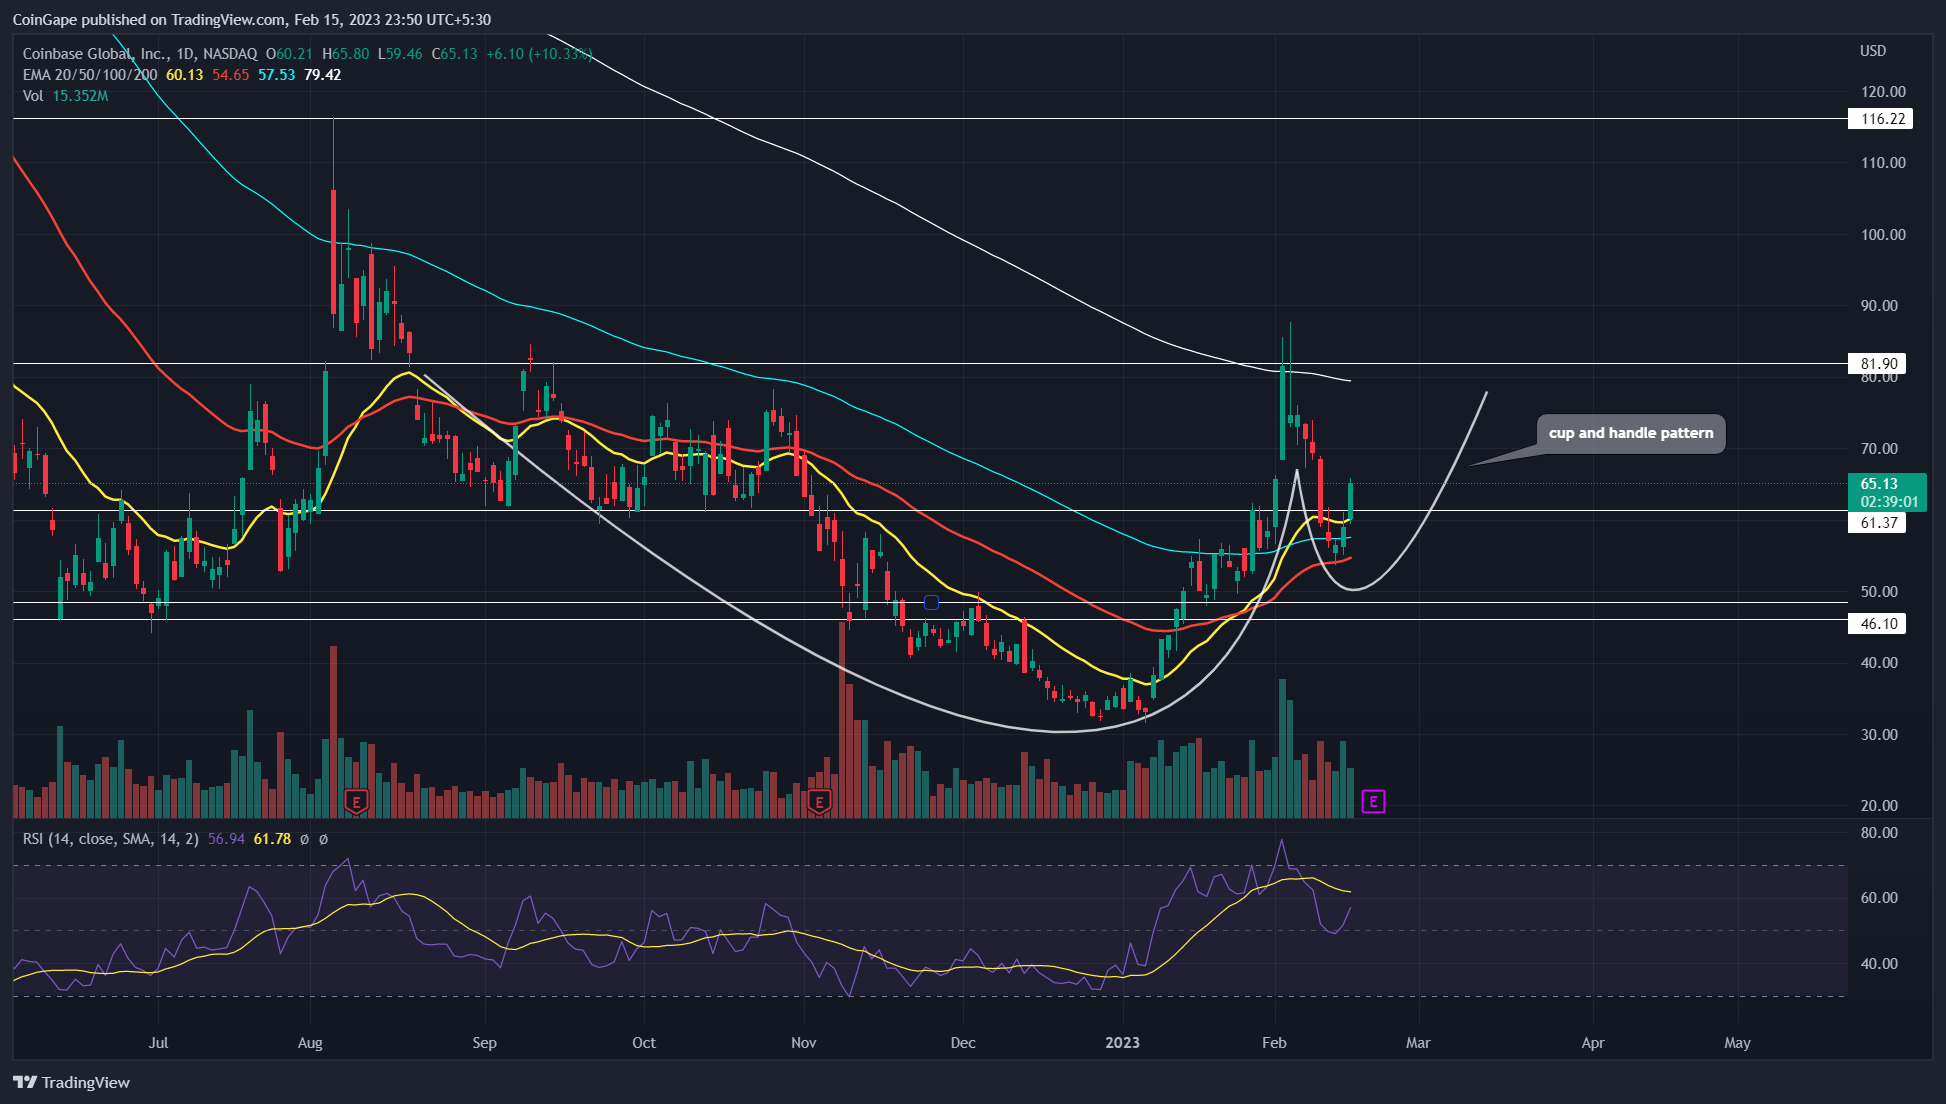
The last three months’ price action in the crypto exchange Coinbase stock price showed the formation of the cup and handle pattern. Moreover, the stock’s recent correction phase was part of this bullish reversal pattern, meant to check price sustainability at higher prices. Here’s how this pattern may further influence COIN stock’s near future price.
advertisement
Key Points:
- The formation of the cup and handle pattern is a sign of sustained recovery and trend reversal.
- A bullish breakout from the $61.4 barrier accelerates underlying buying pressure in the market.
- The 200-day EMA wavering around the $80 mark creates additional resistance against buyers.

 Source-Tradingview
Amid the recent sell-off in the stock market, the crypto exchange coinbase stock price turned down from the monthly resistance of $82.45 and plunged 34.2% down to reach $53.6. This aggressive downfall gave a bearish breakdown from the local support of $61.4 on February 10th, suggesting prolonged correction in the market.
However, with the recent release of January CPI data, the stock market showcased a positive shift in traders’ sentiment, which pushed several asset prices higher. As a result, the crypto exchange coinbase witnessed a midway reversal around the $55 mark and jumped above the $61.4 mark.
Trending Stories
Today, the COIN share price trades at 65.5%, with an intraday gain of 10.2%. If the daily candle closes above the $61.4 mark, the prior breakdown would be marked as beartrap. This fake breakdown may have trapped an aggressive short seller, whose force liquidation may add more buying orders to the market.
Also read: Top 10 DeFi Lending Platforms In 2023
Moreover, under the influence of the cup and handle pattern, the crypto exchange Coinbase price is likely to rise 25% higher to rechallenge the $82.4 neckline resistance.
Technical indicator
RSI: the daily-RSI slope managed to sustain above the midline despite a significant correction, indicating the underlying bullish sentiment is strong
advertisement
EMAs: the 20, 50, and 100 EMAs are offering strong support for rising COIN prices
Coinbase Price Intraday Levels
- Spot rate: $64.78
- Trend: Bullish
- Volatility: Medium
- Resistance levels- $82.4 and $116
- Support levels- $61.4 and $48.5
Share this article on:
The presented content may include the personal opinion of the author and is subject to market condition. Do your market research before investing in cryptocurrencies. The author or the publication does not hold any responsibility for your personal financial loss.
<!– Close Story–>
- SEO Powered Content & PR Distribution. Get Amplified Today.
- Platoblockchain. Web3 Metaverse Intelligence. Knowledge Amplified. Access Here.
- Source: https://coingape.com/markets/coinbase-price-analysis-bear-trap-sets-coin-price-for-25-upswing/
- 1
- 10
- 100
- 2%
- 7
- 9
- a
- above
- accelerates
- Action
- Ad
- Additional
- against
- aggressive
- analysis
- and
- around
- article
- asset
- author
- avatar
- barrier
- Bear
- bearish
- Beauty
- before
- blockchain
- Breakdown
- breakout
- Brian
- Bullish
- buyers
- Buying
- Chart
- check
- Closes
- Coin
- coinbase
- Coinbase price
- Coinbase Stock
- Coingape
- COM
- Commerce
- condition
- content
- correction phase
- CPI
- creates
- crypto
- crypto exchange
- crypto exchange Coinbase
- cryptocurrencies
- cryptocurrency
- Cup
- daily
- DeFi
- DeFi lending
- Despite
- different
- down
- downfall
- EMA
- Entertainment
- exchange
- fake
- Fashion
- February
- finance
- financial
- follow
- Force
- force liquidation
- formation
- from
- further
- future
- Future Price
- Gain
- handle
- higher
- hold
- How
- HTTPS
- in
- include
- Including
- influence
- investing
- journalism
- Jumped
- Last
- lending
- likely
- Liquidation
- local
- loss
- managed
- mark
- marked
- Market
- market research
- MidWay
- monthly
- more
- Near
- offering
- Opinion
- orders
- part
- past
- Pattern
- personal
- phase
- PHP
- Platforms
- plato
- Plato Data Intelligence
- PlatoData
- plugin
- points
- positive
- presented
- pressure
- price
- PRICE ACTION
- Price Analysis
- Prices
- Prior
- Publication
- pushed
- Rate
- reach
- Read
- recent
- recovery
- release
- research
- Resistance
- responsibility
- result
- Reversal
- Rise
- rising
- sell-off
- sentiment
- Sets
- several
- Share
- shift
- Short
- sign
- significant
- stock
- stock market
- strong
- subject
- support
- Sustainability
- The
- three
- to
- Topics
- trades
- TradingView
- Trend
- trending
- Turned
- under
- underlying
- variety
- which
- witnessed
- working
- would
- written
- years
- Your
- zephyrnet


