<!–

–>
Published 15 hours ago
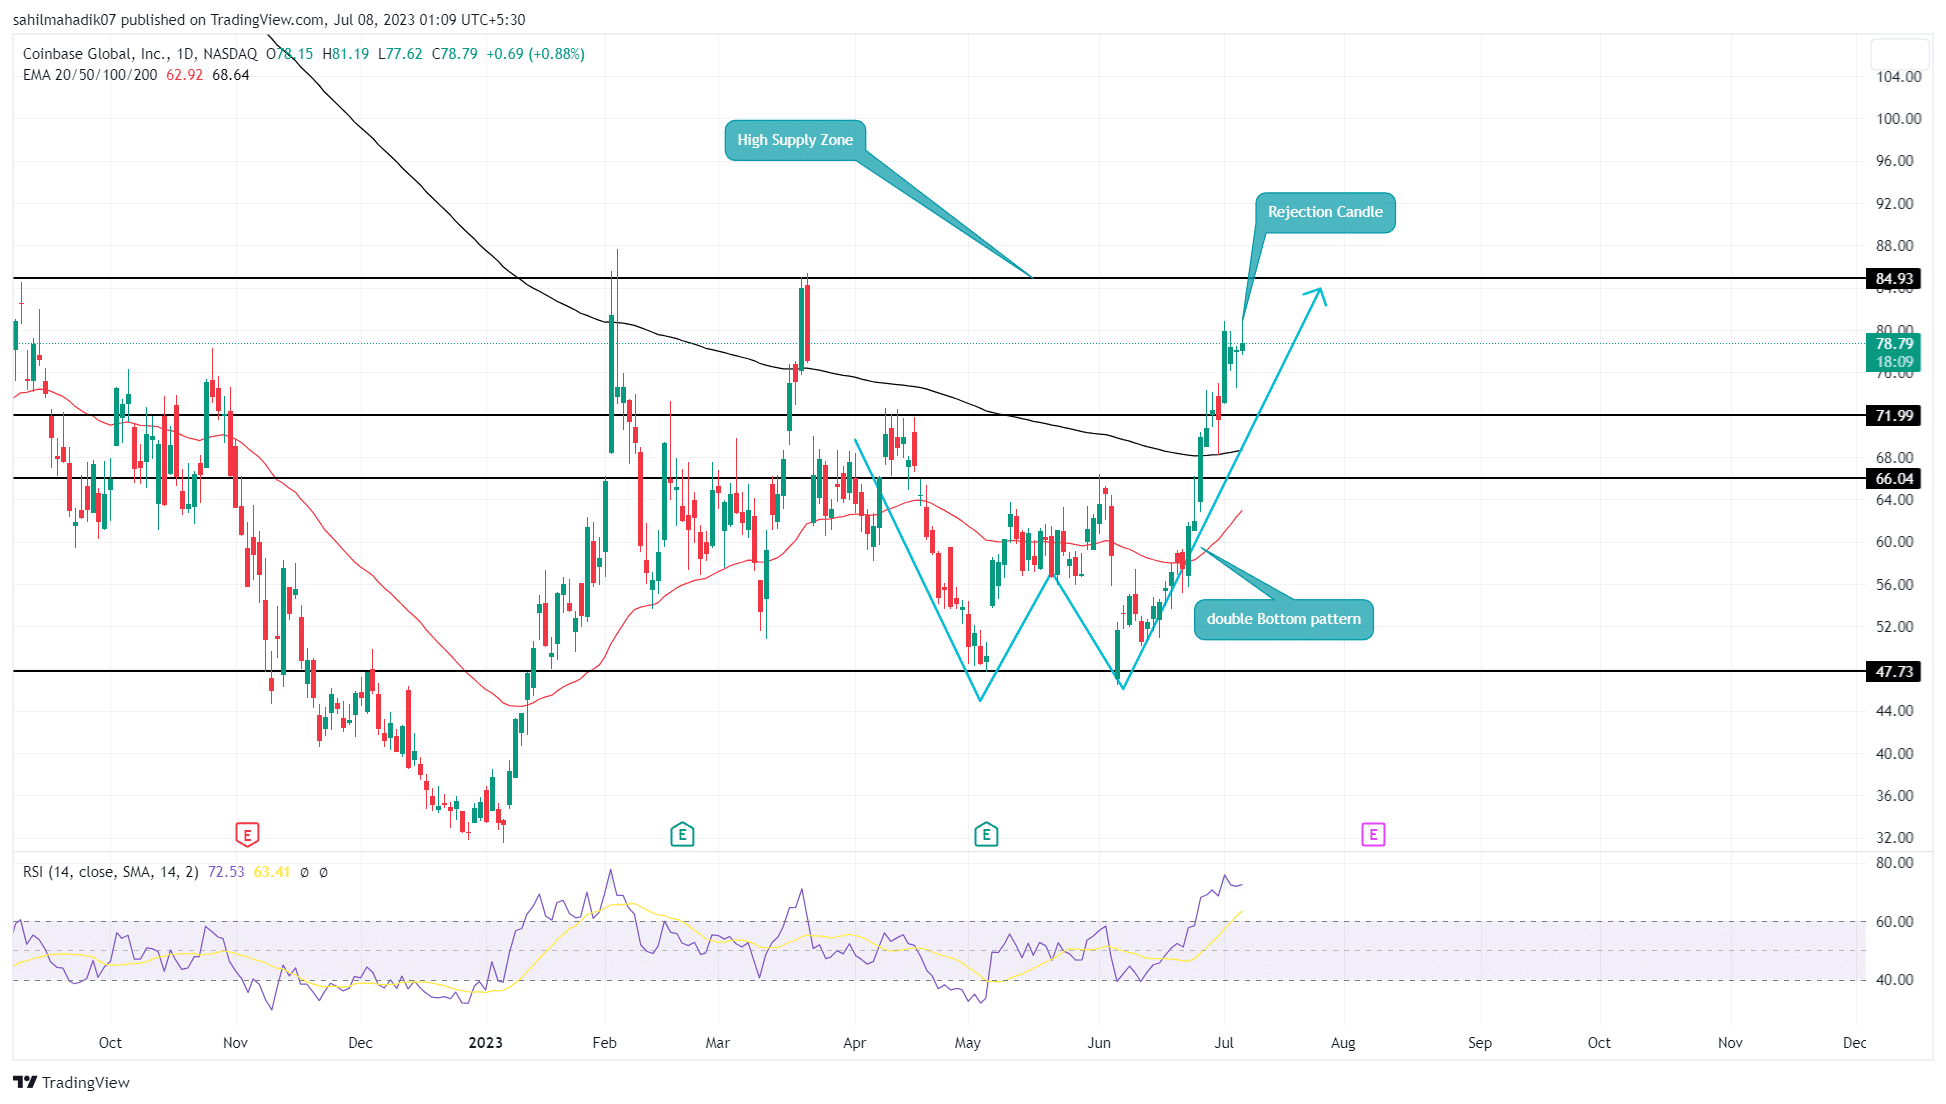
Under the influence of a double bottom pattern, the Coinbase stock price witnessed a parabolic rally last month. This bull march has breached several important resistance such as $66 and $72, restoring the recovery sentiment among market participants. However, the price rejection observed in the daily chart reflects exhausted bullish momentum and the possibility for a minor correction. Is it the right time to enter?
advertisement
Also read: Bitcoin Holdings Shift: Institutions Accumulate BTC as Exchange Balances Plummet
Coinbase Price Daily Chart
- A high-wick rejection candle reflects the possibility of a pullback to $72 before the uptrend continues
- A minor correction could restore the exhausted bullish momentum for a prolong rally
- An upswing of daily EMAs(20, 50, and 100) reflects growing bullish momentum.
 Source-Tradingview
With a remarkable rally starting from $47.7 bottom support, the Coinbase stock price has surged by 70% over the last four weeks. The bull run is likely associated with the completion of the double bottom pattern, at the time when the giant asset management company BlackRock, chose Coinbase as a surveillance partner for its re-filed spot Bitcoin ETF application.
While the double-bottom pattern breakout from $66 neckline has set the COIN price rally to $85, the overhead supply displayed by rejection candles indicates a possibility of retracement. The potential pullback will replenish the bullish momentum before the asset price makes the next leap.
At press time, the Coinbase Stock price trades at $78.82 and forms a second consecutive Doji candle to propose exhausted buying pressure. Therefore, a bearish reversal is likely to retest the $72 support before rechallenging the $85 barrier.
Should You Consider Buying COIN Shares at $72?
With the high selling pressure present at $85 the chances of a bull run continuing to $87 seems unlikely. Therefore, the potential traders must wait for a pullback as the coin price could recuperate bullish momentum at suitable support. The possible support that can assist buyers in maintaining an uptrend and provide long entry opportunities are $72, and $66.
Share this article on:
advertisement
The presented content may include the personal opinion of the author and is subject to market condition. Do your market research before investing in cryptocurrencies. The author or the publication does not hold any responsibility for your personal financial loss.
<!– Close Story–>
- SEO Powered Content & PR Distribution. Get Amplified Today.
- PlatoData.Network Vertical Generative Ai. Empower Yourself. Access Here.
- PlatoAiStream. Web3 Intelligence. Knowledge Amplified. Access Here.
- PlatoESG. Automotive / EVs, Carbon, CleanTech, Energy, Environment, Solar, Waste Management. Access Here.
- BlockOffsets. Modernizing Environmental Offset Ownership. Access Here.
- Source: https://coingape.com/markets/coinbase-price-analysis-whats-next-coin-stock-price-70-rally/
- :has
- :is
- :not
- 1
- 100
- 12
- 15%
- 20
- 200
- 50
- 7
- 72
- 8
- 9
- a
- above
- Accumulate
- Ad
- After
- aggressive
- ago
- am
- among
- an
- analysis
- and
- any
- ARE
- article
- AS
- asset
- asset management
- assist
- associated
- At
- author
- avatar
- balances
- barrier
- bearish
- Beauty
- before
- Bitcoin
- Bitcoin ETF
- BlackRock
- blockchain
- Bottom
- breakout
- Brian
- BTC
- bull
- Bull Run
- Bullish
- buyers
- Buying
- by
- CAN
- Candles
- chances
- Chart
- chose
- Coin
- COIN shares
- coinbase
- Coinbase price
- Coinbase Stock
- Coingape
- COM
- company
- completion
- condition
- consecutive
- Consider
- content
- continuing
- could
- cryptocurrencies
- cryptocurrency
- daily
- different
- displayed
- do
- does
- double
- double bottom
- Enter
- Entertainment
- entry
- ETF
- exchange
- Fashion
- finance
- financial
- follow
- For
- forms
- four
- from
- giant
- Growing
- Have
- High
- hold
- Holdings
- HOURS
- However
- HTTPS
- i
- important
- in
- include
- Including
- index
- indicates
- influence
- institutions
- investing
- IT
- ITS
- journalism
- Last
- Leap
- likely
- Long
- loss
- Maintaining
- MAKES
- management
- March
- Market
- market research
- May..
- me
- minor
- Momentum
- Month
- moving
- must
- next
- of
- on
- Opinion
- opportunities
- or
- out
- over
- parabolic
- participants
- partner
- past
- Pattern
- personal
- photo
- plato
- Plato Data Intelligence
- PlatoData
- plugin
- possibility
- possible
- potential
- present
- presented
- press
- pressure
- price
- Price Analysis
- price rally
- propose
- provide
- Publication
- pullback
- rally
- reach
- Read
- recovery
- recuperate
- reflects
- remarkable
- replenish
- research
- Resistance
- responsibility
- restore
- restoring
- retracement
- Reversal
- right
- Run
- Second
- seems
- Selling
- sentiment
- set
- several
- Share
- Shares
- shift
- Spot
- Spot Bitcoin Etf
- Starting
- stock
- strength
- subject
- such
- suitable
- supply
- support
- Surged
- surveillance
- that
- The
- The Coinbase
- therefore
- this
- time
- to
- Topics
- Traders
- trades
- TradingView
- unlikely
- uptrend
- variety
- wait
- Weeks
- when
- will
- with
- witnessed
- working
- written
- years
- You
- Your
- zephyrnet


