TL;DR Breakdown
- The Cosmos price analysis shows bullish momentum.
- The resistance is present at the $34.6 level.
- Support for ATOM/USD is at $32.1.
The Cosmos price analysis shows that the bulls are successfully carrying their lead and have crafted an upwards trending line after 21 February. The price has been rising and is planning to breach past the $34.6 resistance. The recent uptrend has been quite encouraging as during the past week, the cryptocurrency has recovered significantly, and the price has finally reached the $34.1 former high. The bullish momentum is increasing gradually, and a further improvement in the price value can be expected.
ATOM/USD 1-day price chart: Bulls bounce back as the price escalates towards $34.6
The one-day Cosmos price analysis is going positive for the cryptocurrency as there has been a considerable amount of rising in the price value. The price has now surpassed the $34 level and is aiming to settle down at a higher level as it is moving towards the next resistance present at $34.6. The ATOM/USD is trading at $34.1 at the time of writing and has gained a value of 3.4 percent during the last 24 hours.

Meanwhile, the moving average (MA) for the 1-day chart is at $30.2 as there has been bullish activity during the last week as well. At the same time, the Bollinger bands are making an average of $28.2 in the 1-day ATOM/USD price chart. The volatility has been towards the increasing side for the day, and the Bollinger bands values are situated at the following marks; the upper band is at $34.1, just below the price level, whereas the lower band is at $22.2. The Relative Strength Index (RSI) score is 62, as the indicator is trading in the upper half of the neutral zone.
Cosmos price analysis: Recent developments and further technical indications
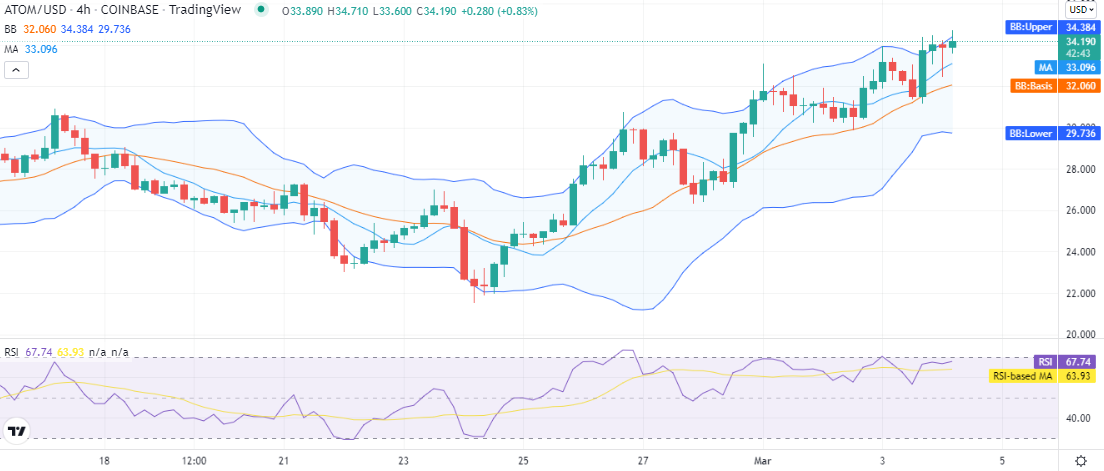
The 4-hour Cosmos price analysis chart shows the price is flying high once again as the bulls have gained back some strength during the past couple of hours. The current ATOM/USD price is going $34.19 and is expected to touch an even greater height. In comparison, the moving average is at the $33 level for the 4-hours price chart. The bulls have gained the advantage of the situation as they have been able to elevate the price levels considerably.

The Bollinger bands indicator gives us the following values; the upper value is $34.3 representing the resistance for ATOM price function, and the lower value is $29.7 representing the support. The RSI score has undergone improvement during the last four hours as well because of the recent uptrend and has reached index 67 near the border of the overbought zone.
Cosmos price analysis conclusion
The Cosmos price analysis suggests the trend for ATOM/USD has been bullish for the day as the bulls are trying to carry their lead in a broader bearish market. The price has leveled up again as it has successfully reached the $34.1 position. The bullish momentum is expected to intensify in the future as long as the support remains standing above $32. We expect ATOM to retest $34.6 as resistance in the coming hours.
Disclaimer. The information provided is not trading advice. Cryptopolitan.com holds no liability for any investments made based on the information provided on this page. We strongly recommend independent research and/or consultation with a qualified professional before making any investment decisions.
- 67
- 7
- activity
- ADvantage
- advice
- Aiming
- amount
- analysis
- atom
- average
- bearish
- border
- breach
- Bullish
- Bulls
- carrying
- coming
- continue
- Cosmos
- Couple
- cryptocurrency
- Current
- day
- developments
- down
- ELEVATE
- encouraging
- expect
- expected
- Finally
- following
- function
- future
- going
- height
- High
- holds
- HTTPS
- index
- information
- investment
- Investments
- IT
- lead
- Level
- liability
- Line
- Long
- Making
- Market
- Momentum
- moving
- Near
- planning
- present
- price
- Price Analysis
- professional
- qualified
- recommend
- research
- Successfully
- support
- Technical
- time
- touch
- Trading
- trending
- us
- value
- Volatility
- week
- writing


