Chainlink (LINK) is following a descending resistance line and facing resistance at $34.1.
Uniswap (UNI) has bounced at the $17.50 support area and reached the 0.5 Fib retracement level at $29.
Graph (GRT) is trading inside an extensive descending parallel channel.
LINK
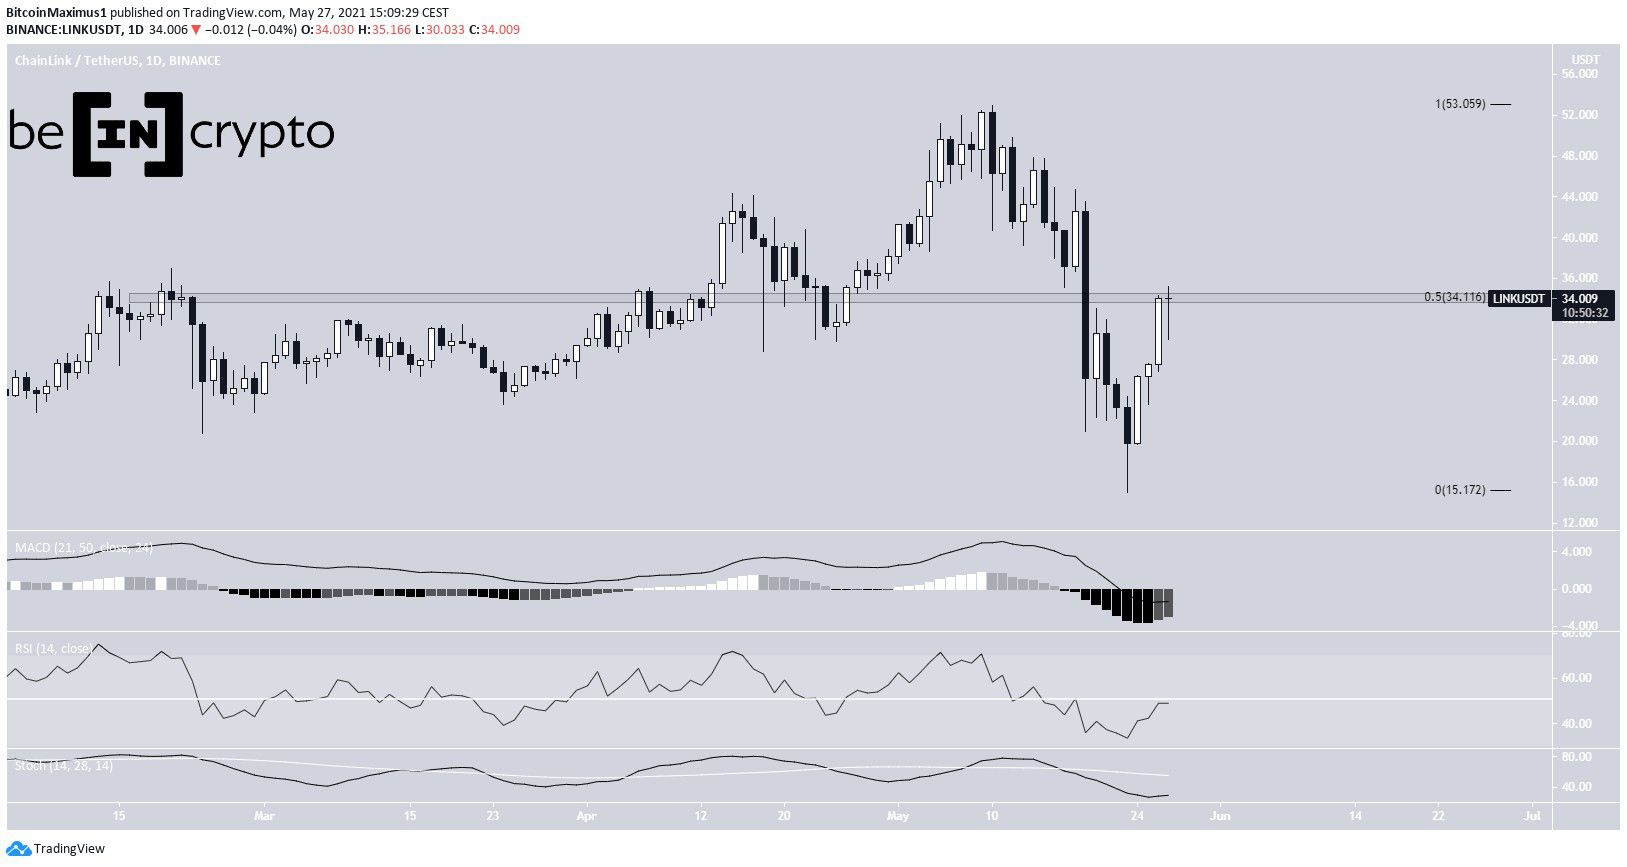
LINK has been moving downwards since reaching an all-time high price of $53, on May 10. It continued falling until May 23, attaining a low of $15. It has been moving upwards since.
There is strong resistance at $34.1. The resistance is created by the 0.5 Fib retracement level and is also a horizontal resistance area. Currently, LINK is trading inside the area and has yet to break out.
Technical indicators are showing some bullish signs. The MACD has created a higher momentum bar and is increasing. However, the RSI has yet to break out above 50 and the Stochastic oscillator has not made a bullish cross.

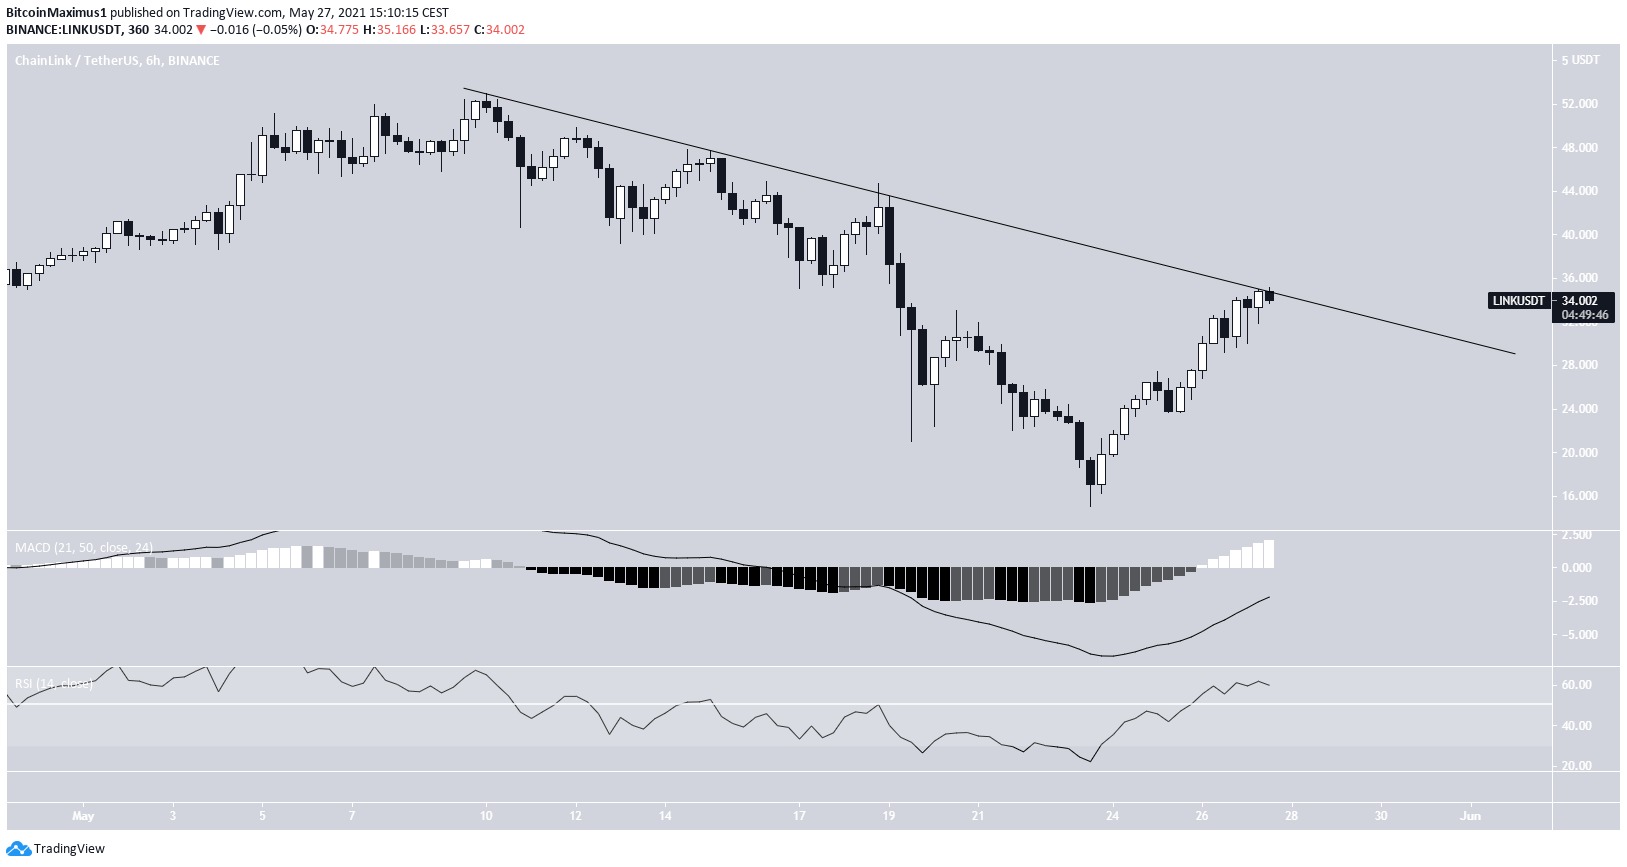
The shorter-term six-hour chart shows a descending resistance line in place since the aforementioned all-time high.
At the time of writing, LINK was making a breakout attempt. Both the RSI and MACD support the breakout. Therefore, a reclaim above this line would also cause a reclaim of the $34.1 area, confirming the bullish trend reversal.

Highlights
- LINK is facing resistance at $34.1
- It is following a descending resistance line.
UNI
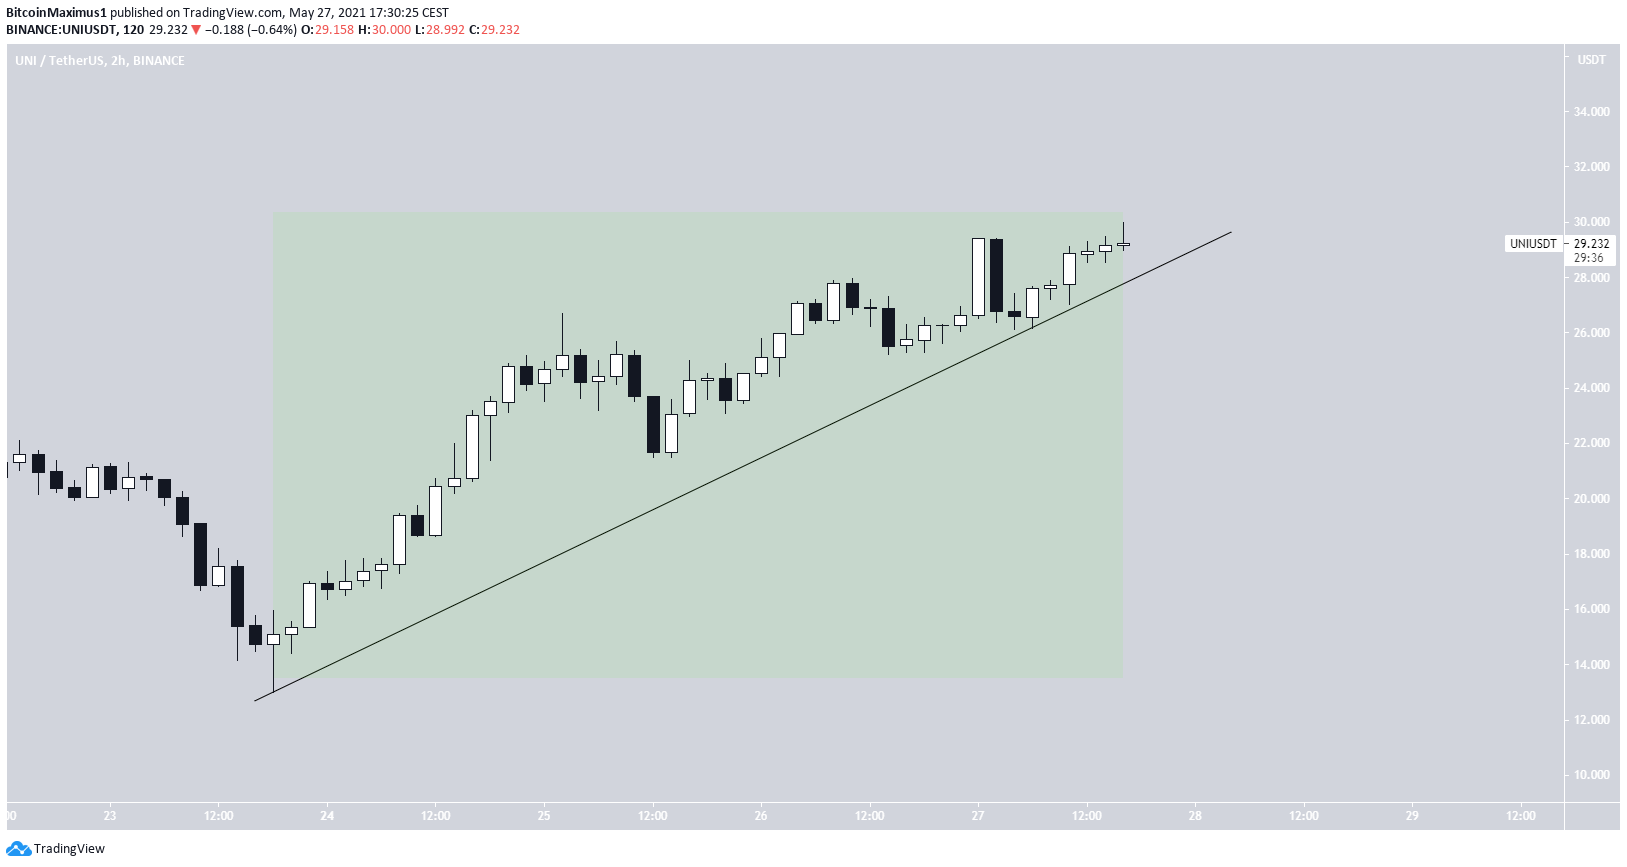
UNI has been moving downwards since May 5, when it reached an all-time high price of $44.9. The downward movement culminated with a low of $13, reached on May 23. The token has been moving upwards since.
Technical indicators are showing signs of a bullish trend reversal. The RSI is increasing, being close to moving above 50. Similarly, the Stochastic oscillator has begun to move upwards. Furthermore, the MACD has given a bullish reversal signal.
There is resistance at $28.8, created by the 0.5 Fib retracement level. The movement of the lows does look like the beginning of a bullish impulse. However, its rate of increase is also likely unsustainable.

Therefore, UNI is likely to get rejected at some point and break down, before creating a higher low and resuming its upward movement.

Highlights
- There is support at $17.5
- There is resistance at $28.8
GRT
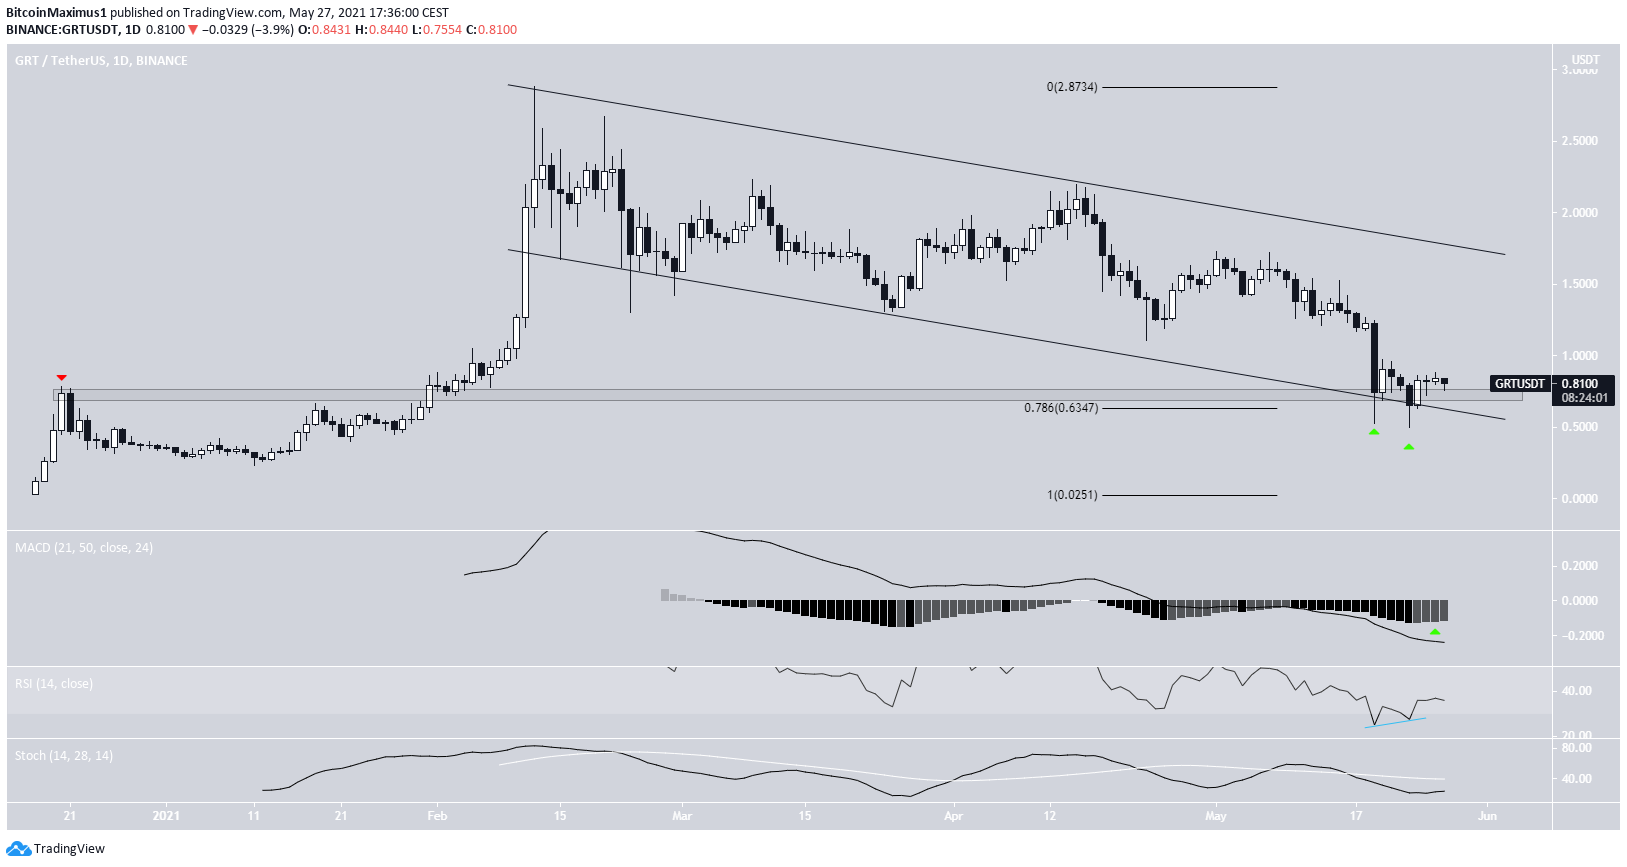
GRT has been decreasing since Feb. 12, when it reached an all-time high price of $2.88. Throughout the decrease, it has been trading inside a descending parallel channel. These channels often contain corrective structures.
On May 19 and May 23, GRT bounced at the support line of the channel, creating two long lower wicks (green icons). The bounces were combined with bullish divergence in the RSI and caused a reclaim of the $0.74 area, which is now likely to act as support.
The MACD has also given a bullish reversal signal. Therefore, the most likely scenario would have the token increasing towards the resistance line of the channel.

Highlights
- GRT is trading inside a descending parallel channel.
- There is support at $0.73.
For BeInCrypto’s latest bitcoin (BTC) analysis, click here.
Disclaimer
All the information contained on our website is published in good faith and for general information purposes only. Any action the reader takes upon the information found on our website is strictly at their own risk.
Source: https://beincrypto.com/defi-coins-bounce-pursue-reclaim/
- 2019
- 9
- Action
- All
- analysis
- AREA
- barcelona
- breakout
- BTC
- Bullish
- Cause
- caused
- channels
- Coins
- Creating
- cryptocurrencies
- cryptocurrency
- data
- DeFi
- Development
- Economic
- Economics
- facing
- financial
- Focus
- General
- good
- graduate
- Green
- here
- High
- HTTPS
- Increase
- information
- IT
- Level
- Line
- LINK
- Long
- Making
- Markets
- Momentum
- move
- price
- Reader
- Risk
- School
- Signs
- support
- time
- token
- trader
- Trading
- Website
- writing
- youtube


