SNEAK PEEK
- Hashkey’s strategic investments prove their market acumen in volatile times.
- ETH’s bullish momentum presents potential buying opportunities.
- Volatility persists in the ETH market, offering entry and exit points for traders.
Hashkey, a savvy investor, recently made a bold move by spending 7.47M $ USD to purchase 4,578 $ETH at $1,643 from Binance during the USDT depegging. This strategic move proved a wise investment as Hashkey demonstrated their astute understanding of the market and their confidence in the potential of $ETH. They made another smart investment by purchasing 1,747 $ETH ($2.5M) at $1,431 during the USDC depegging.
Hashkey spent 7.47M $USDT to buy 4,578 $ETH at $1,643 from #Binance during the #USDT depegging yesterday.
Hashkey is very smart on $ETH.
Bought 1,747 $ETH ($2.5M) at $1,431 during #USDC depegging.
Sold 3,540 $ETH ($7.4M) at $2,091 at the highest price point of this year. pic.twitter.com/LrPFHWZgXx
— Lookonchain (@lookonchain) June 16, 2023
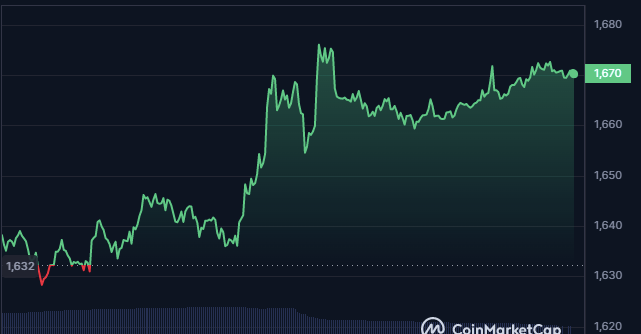
During the trading session, the Ethereum (ETH) market was under bulls’ control, pushing prices from an intraday low of $1,624.14 to a 24-hour high of $1,676.41. As of press time, ETH was still trending upward, trading at $1,669.90, up 2.14% from the previous close.
However, ETH’s market capitalization climbed by 2.13% to $200,794,863,007 despite a 28.40% drop in 24-hour trading volume to $6,297,415,816. This action shows that investors are still bullish on the market despite the recent decline in activity.

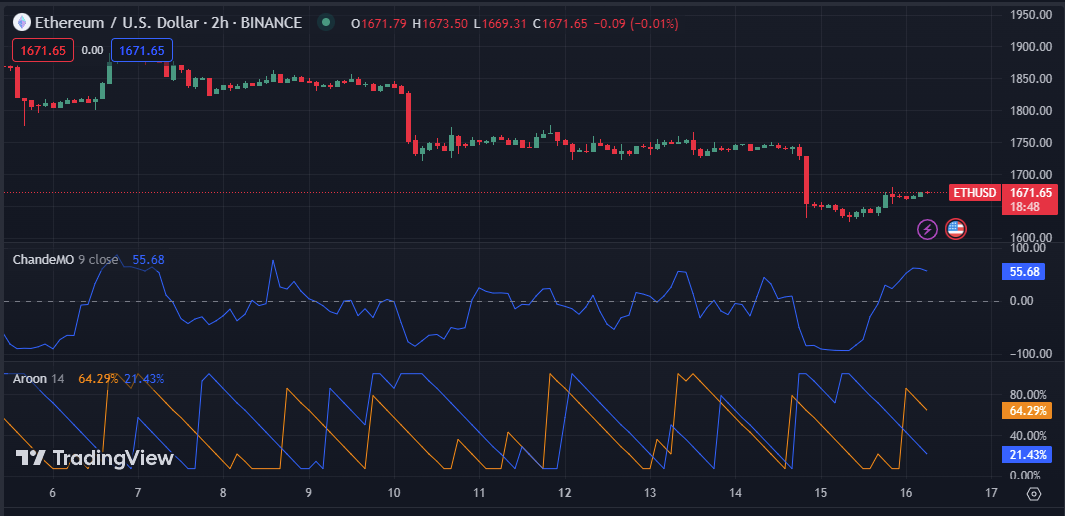
The Chande Momentum oscillator (ChandeMo) on the 2-hour price chart for ETH has a line pointing north and a value of 55.68. With this movement, buyers control the market, and the ETH market is showing significant bullish momentum. Traders might consider buying ETH or holding onto their existing positions to ride the upward trend.
The Aroon up and down values are 64.29% and 21.43%, respectively, on ETH’s 2-hour price chart. This motion indicates that the trend is strong and is likely to last for a while, although there may be brief reversals along the way, allowing traders to pinpoint potential entry and exit points for trades.

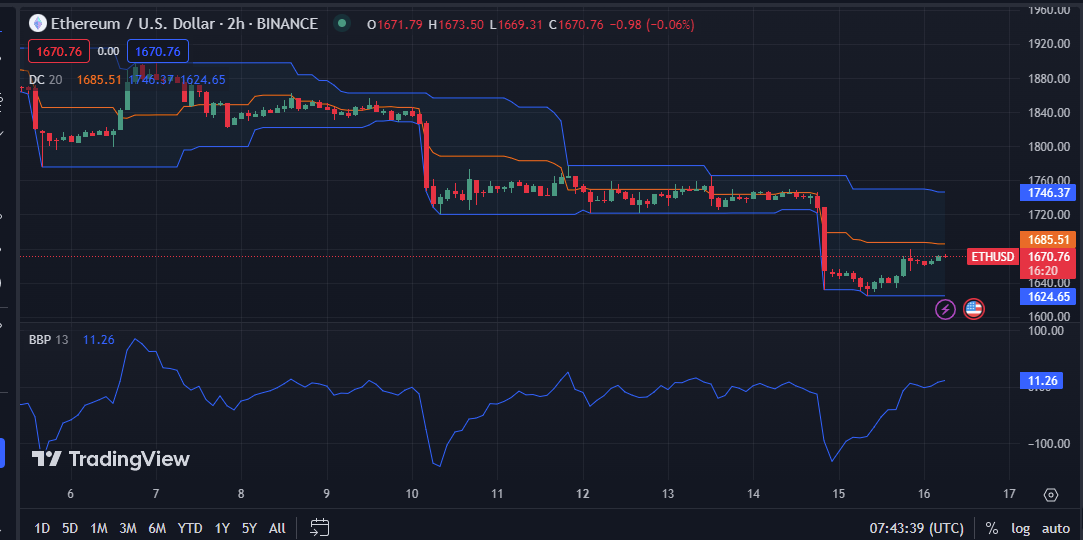
The Bull Bear Power (BBP), which has a value of 11.26, is pointing north on the 2-hour price chart for ETH. This movement suggests that the bulls are gaining control of the market and that there is increased buying interest. To profit from this bullish momentum, traders may consider opening a long position or holding onto their current positions.
On the 2-hour price chart for the ETH market, the Donchian Channels (DC) up and down readings are 1746.04 and 1624.34, respectively. This action suggests that the market is experiencing some volatility, with prices fluctuating between these two levels, as the price is within a constrained range.

In conclusion, with ETH’s bullish momentum and Hashkey’s calculated investments, the volatile market becomes a realm of profitable opportunities and strategic moves.
Disclaimer: Cryptocurrency price is highly speculative and volatile and should not be considered financial advice. Past and current performance is not indicative of future results. Always research and consult with a financial advisor before making investment decisions.
- SEO Powered Content & PR Distribution. Get Amplified Today.
- EVM Finance. Unified Interface for Decentralized Finance. Access Here.
- Quantum Media Group. IR/PR Amplified. Access Here.
- PlatoAiStream. Web3 Data Intelligence. Knowledge Amplified. Access Here.
- Source: https://investorbites.com/ethereum-eth-price-analysis-16-06/
- :has
- :is
- :not
- $UP
- 1
- 11
- 14
- 16
- 22
- 26%
- 28
- 7
- a
- Action
- activity
- acumen
- advice
- advisor
- ahead
- Allowing
- along
- Although
- always
- an
- analysis
- and
- Another
- ARE
- AS
- At
- BE
- Bear
- becomes
- before
- between
- binance
- bold
- bull
- Bullish
- Bulls
- buy
- buyers
- Buying
- by
- calculated
- capitalization
- Center
- channels
- charge
- Chart
- Climbed
- Close
- CoinMarketCap
- conclusion
- confidence
- Consider
- considered
- control
- Current
- dc
- decisions
- Decline
- demonstrated
- DEPEGGING
- Despite
- down
- Drop
- during
- entry
- ETH
- eth market
- ETH/USD
- ethereum
- Ethereum News
- Ethereum Price
- Ethereum Price Analysis
- existing
- Exit
- experiencing
- external
- facts
- financial
- financial advice
- For
- from
- future
- gaining
- hashkey
- High
- highest
- highly
- holding
- HTTPS
- important
- in
- increased
- indicates
- internal
- investment
- Investments
- investor
- Investors
- Last
- levels
- likely
- Line
- Long
- Low
- made
- MAKES
- Making
- Market
- Market Capitalization
- Market News
- May..
- might
- Momentum
- motion
- move
- movement
- moves
- news
- North
- of
- offering
- on
- opening
- opportunities
- or
- past
- performance
- persists
- plato
- Plato Data Intelligence
- PlatoData
- Point
- points
- position
- positions
- potential
- power
- presents
- press
- previous
- price
- Price Analysis
- price chart
- Prices
- Profit
- profitable
- Prove
- proved
- purchase
- purchasing
- Pushing
- range
- realm
- recent
- recently
- research
- respectively
- Results
- Revealed
- Ride
- savvy
- session
- should
- Shows
- significant
- smart
- some
- Source
- speculative
- Spending
- spent
- stablecoin
- Still
- Strategic
- strong
- Suggests
- that
- The
- their
- There.
- These
- they
- this
- this year
- time
- times
- to
- Traders
- trades
- Trading
- trading volume
- TradingView
- Trend
- trending
- two
- under
- understanding
- upward
- USD
- USDC
- value
- Values
- very
- volatile
- Volatility
- volume
- was
- Way..
- What
- What is
- which
- while
- WISE
- with
- within
- year
- yesterday
- zephyrnet


