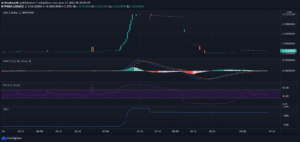
The FLOW coin price jumps 25% from a demand-rich area to create a rising three pattern. Will the bullish revolt break the falling channel? The Flow blockchain is a fast and decentralized user-friendly blockchain that was designed to be the basis for a new generation of apps, games, and those digital assets that run these. It’s the only layer-one blockchain that was developed by a group that has consistently provided excellent user-friendly blockchain experiences for consumers: CryptoKitties, Dapper Wallet, NBA Top Shot. Let us move ahead to read about Flow technical analysis. Past Performance of FLOW The FLOW coin price shows a downtrend channel in play that fuels the correction phase in the daily chart. The coin price finds support near the trendline and the horizontal level of $4.6. The coin price jumps more than 25% in the past 72 hours resulting in a rising three method formation. FLOW/USD Daily Chart FLOW Technical Analysis The FLOW coin price approaches the resistance trendline of the falling channel pattern in the price chart with the recent 25% jump. However, despite the bullish price action and pattern formation, it needs to overcome sellers at the resistance trendline to continue the uptrend. The crucial Exponential Moving Averages show a falling trend in the daily chart as the price trades lower than the EMAs. Moreover, the 50-day EMA acts as a dynamic resistance fueling the downtrend. The RSI Indicator shows the slope exiting the oversold zone with a bang as it spikes closer to central mar. Moreover, the slope gives a bullish crossover with the 14-day SMA. The MACD Indicator shows sharp growth in the fast line resulting in a bullish crossover. Moreover, the slope shows the presence of a bullish divergence in the price action. Therefore, the support of technical indicators to the bullish rally increases the possibility of the falling channel breakout. That is why safe traders need to wait till the FLOW prices surpass the trendline. Upcoming Trend The FLOW technical analysis shows coin price rising higher to the resistance trendline of the falling channel with the recent jump from $4.6. Moreover, the rising three method increases the chances of a bullish continuation. That is why buyers at the current price can ride a bullish ride to the next crucial resistance level at $8. However, in case of a reversal from the resistance trendline, a downfall to $4 is possible. At press time, the technical analysis by TradingView gives a “SELL” signal for the FLOW token. Technical Analysis for FLOWUSD by TradingView { “interval”: “1D”, “width”: “100%”, “isTransparent”: false, “height”: “100%”, “symbol”: “BINANCE:FLOWUSD”, “showIntervalTabs”: true, “locale”: “in”, “colorTheme”: “dark” }
The post FLOW Technical Analysis: Bullish Revolt Plan To Escape Falling Channel appeared first on Cryptoknowmics-Crypto News and Media Platform.
- "
- About
- Action
- analysis
- apps
- AREA
- Assets
- basis
- blockchain
- breakout
- Bullish
- chances
- closer
- Coin
- Consumers
- continue
- Cryptokitties
- Current
- decentralized
- developed
- digital
- Digital Assets
- Display
- dynamic
- EMA
- Experiences
- FAST
- finds
- First
- flow
- For Consumers
- Games
- Group
- Growth
- HTTPS
- IT
- jump
- Level
- Line
- Media
- move
- NBA
- Near
- news
- Pattern
- performance
- phase
- Play
- press
- price
- rally
- Run
- safe
- Sellers
- support
- Technical
- Technical Analysis
- time
- token
- top
- Traders
- trades
- us
- wait
- Wallet


