Bitcoin’s price continues to struggle in an attempt to recover. The action during the weekend was choppy at best, and the cryptocurrency even lost some of its value. With this said, it’s worth looking at the most probable scenarios for BTC following the recent events and the critical levels in each case.
Technical Analysis
By: Shayan
Daily Time Frame
The price has failed to register a higher high price action pattern in the daily time frame, and the range’s top and the 100-day moving average has rejected it. Currently, Bitcoin is above a critical support zone around the $36.3K-$37.3K region. The cryptocurrency needs to maintain the mentioned support zone to start another surge to the range’s top.
On the other hand, if BTC breaks below this substantial level, this might propel further declines. In this case, the next support level will be at the range’s bottom, which is the $34K to $35K area.

4H Time Frame
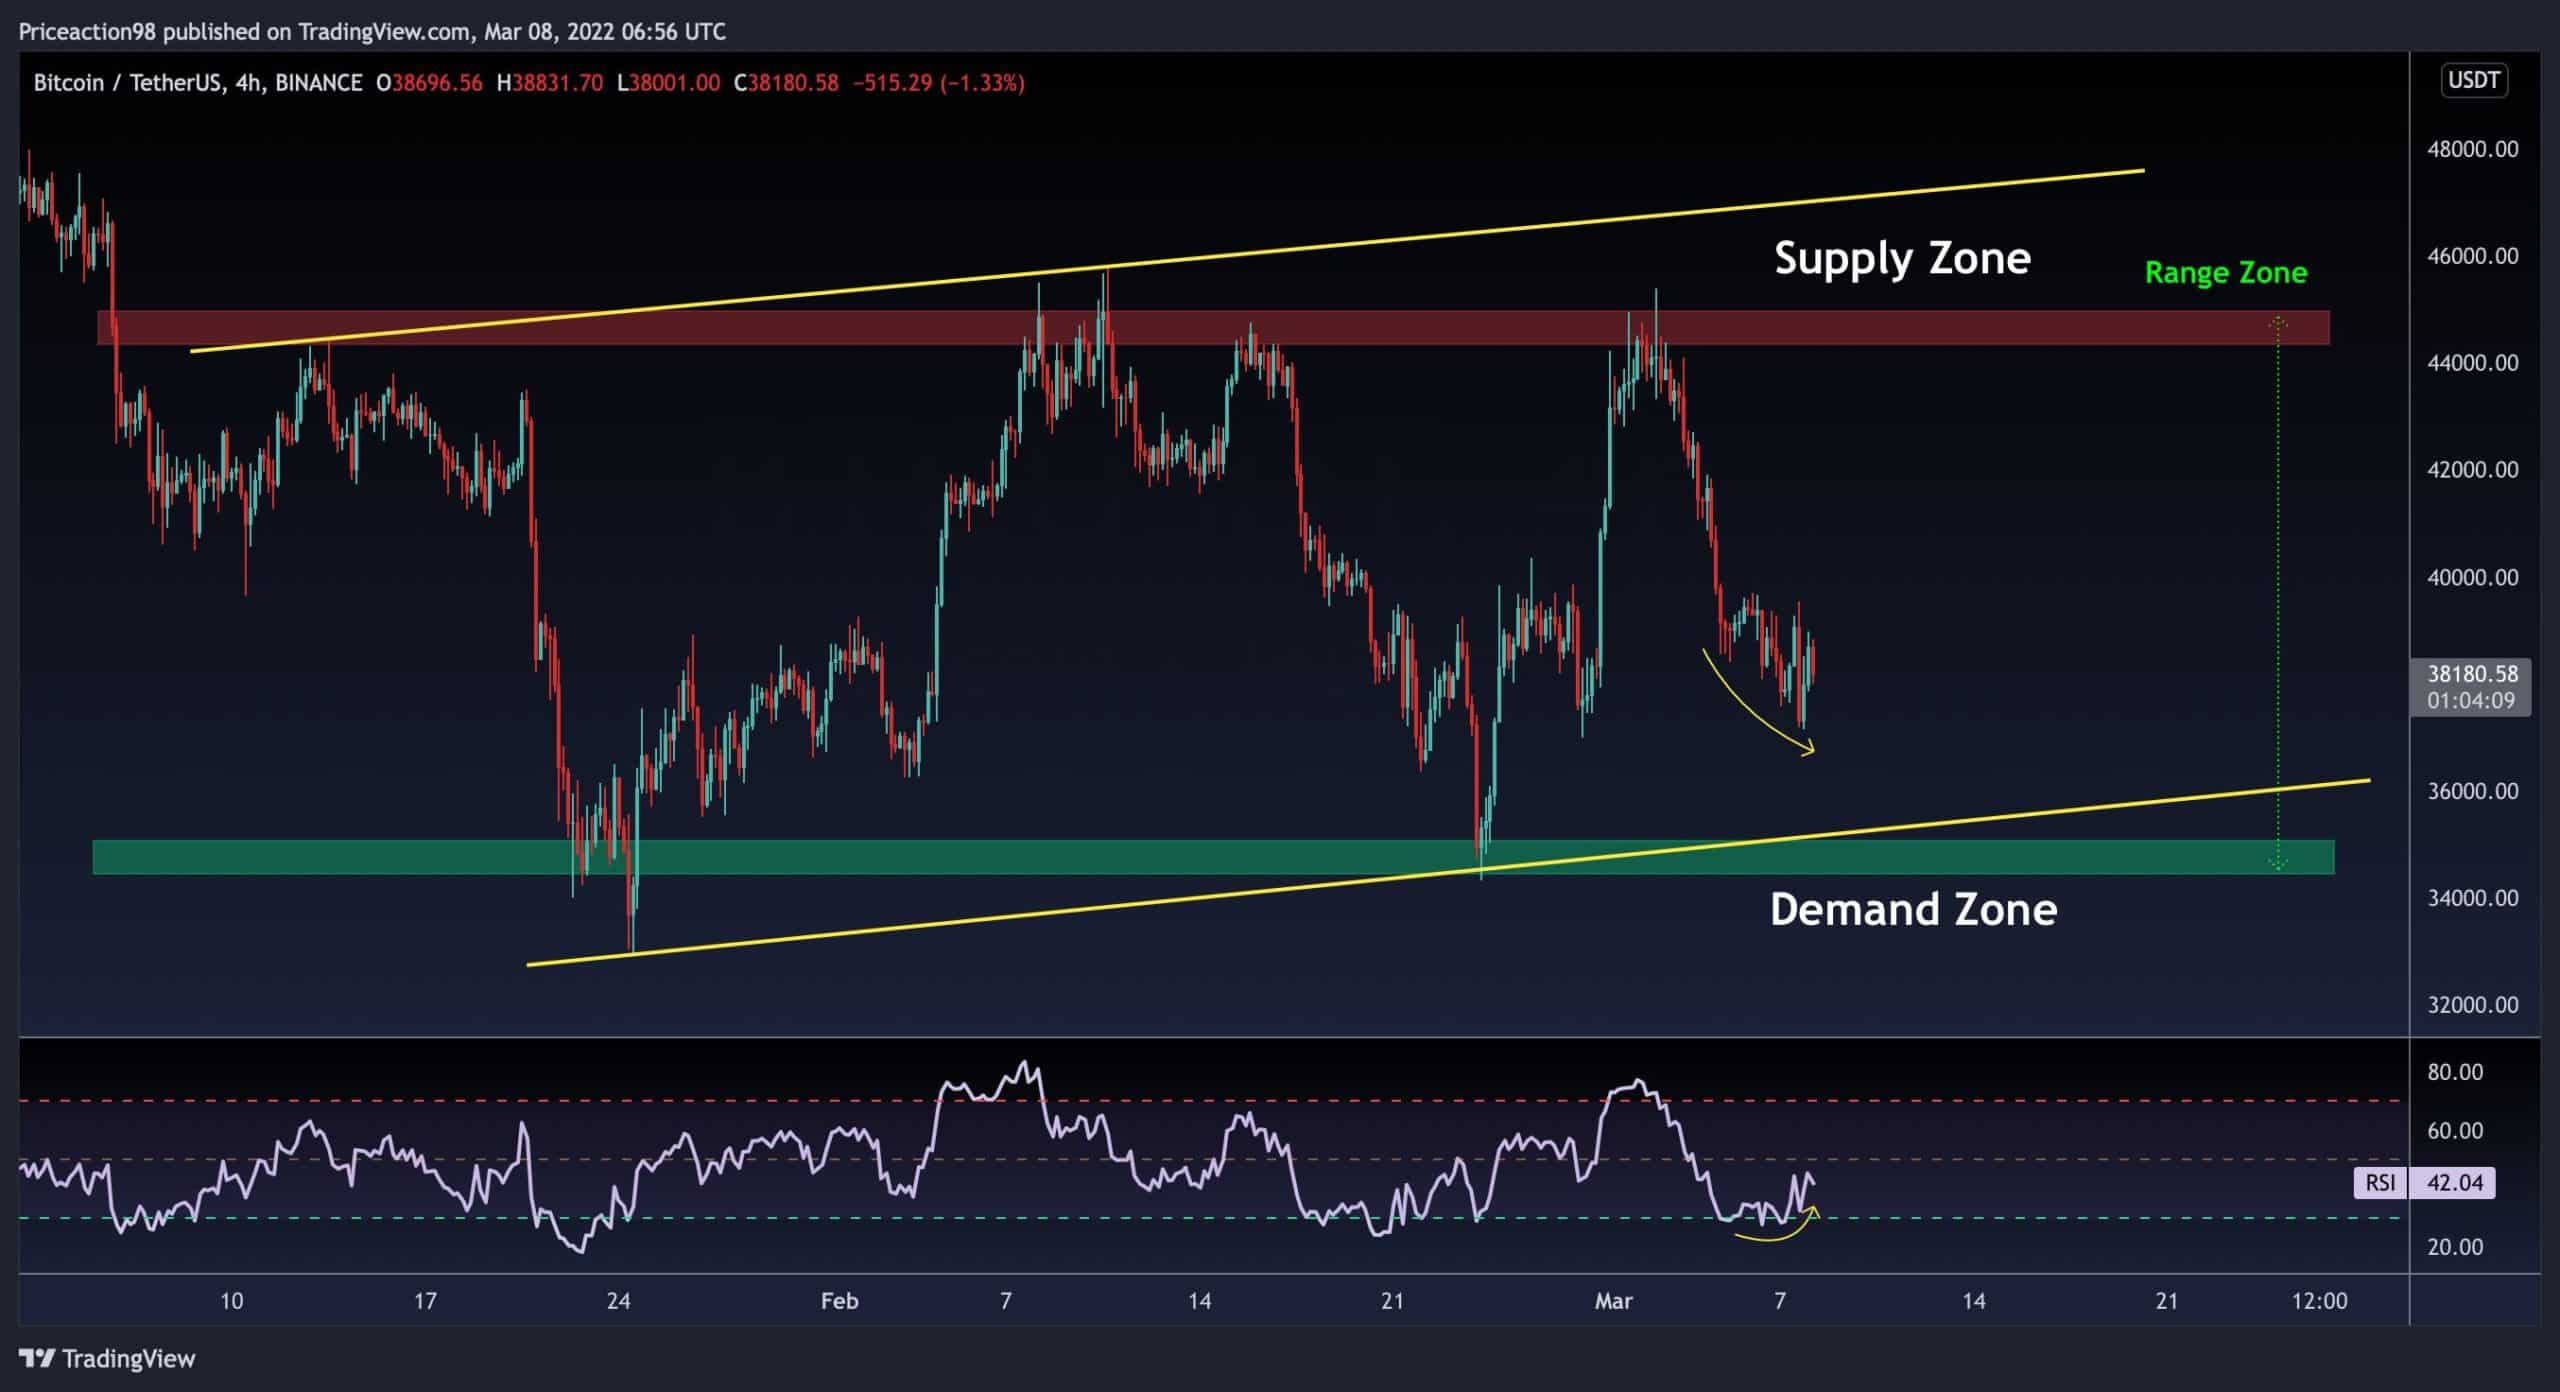
The chart shows that Bitcoin is now consolidating between two evident supply and demand zones. The immediate resistance level is near $45K, while the significant support level is around $34K.
The price has been plummeting with strong bearish momentum, which indicates that the bears have taken control. However, a clear divergence between the price and the RSI indicator has decreased the bearish momentum and may lead to a reversal. In contrast, Bitcoin has formed a bearish continuation correction pattern (Yellow trendlines). Another extreme bearish move will be expected if the bottom trendline does not hold.

Onchain Analysis
By: Edris
All Miners’ Reserve (EMA 30)
Miners keep accumulating bitcoin amid all the uncertainty surrounding the global economy and politics. They are considered influential entities in network security and issuance integrity.
Analyzing their behavior could also prove very useful in predicting where the price might be headed next. They were also accumulating Bitcoin aggressively before the 2020-2021 bull run when the cryptocurrency ranged between $5K-$10K. After the bull run started, their accumulation rate became flat, and then, they rapidly distributed their supply in late 2020-early 2021, which significantly weakened the uptrend.
After this massive distribution, a slow and steady accumulation began once again, which is going on today. This behavior is very similar to that of early 2020 and the pre-bull run consolidation of the price, indicating that the miners expect higher mid-term prices and do not consider current rates appropriate for selling their coins.
However, this could also be because most of them have migrated to the U.S. from china over the last two years and have more financial support and security, and are not under a lot of pressure to sell their coins amid the intense volatility of the price over the last year.

- 2020
- 2021
- Action
- All
- analysis
- Another
- AREA
- around
- average
- bearish
- Bearish Momentum
- Bears
- BEST
- Bitcoin
- Bitcoin Price
- Bitcoin Price Analysis
- BTC
- Bull Run
- China
- Coins
- consolidation
- continues
- control
- could
- cryptocurrency
- Current
- Demand
- distributed
- distribution
- Early
- economy
- EMA
- events
- expect
- expected
- extreme
- financial
- following
- Global
- Global economy
- going
- here
- High
- hold
- HTTPS
- IT
- lead
- Level
- looking
- Miners
- Momentum
- most
- move
- moving
- Near
- network
- Network Security
- Other
- Pattern
- politics
- possible
- pressure
- price
- Price Analysis
- Rates
- Recover
- register
- Run
- Said
- security
- sell
- significant
- similar
- start
- started
- strong
- substantial
- supply
- support
- support level
- surge
- time
- today
- top
- u.s.
- value
- Volatility
- weekend
- worth
- year
- years


