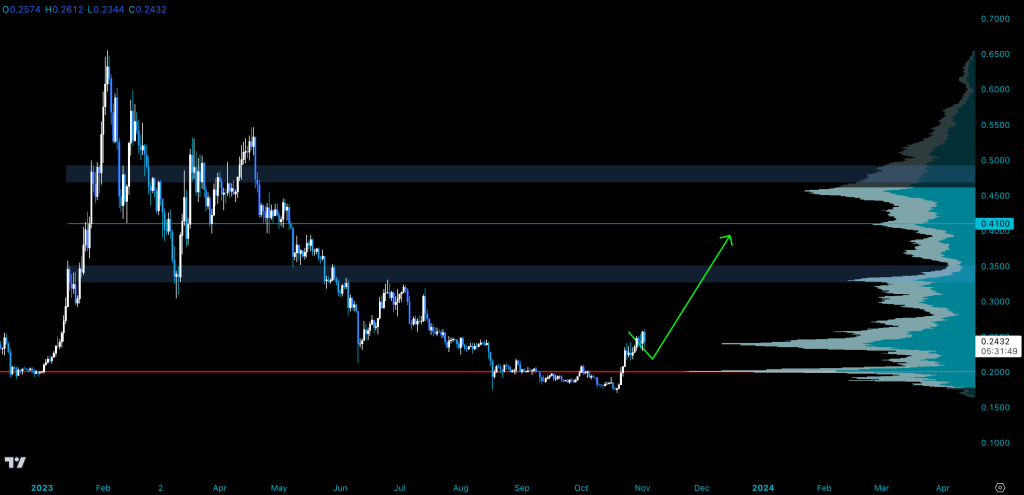
FTM, the native currency of the Fantom ecosystem, might be the next coin to follow and perhaps outperform Solana (SOL). This optimistic preview is by one technical analyst, “Magnate,” who, in an X post on October 3, said traders who missed the SOL rally may have a chance with FTM.

Solana Is Exploding: Reverses Post-FTX Losses
At press time, SOL is trading at new 2023 highs and has reversed all post-FTX losses. Changing hands at $39 as of writing on November 3, the SOL uptrend remains, looking at the candlestick arrangement in the daily chart. Specifically, SOL is up 125% from September lows and 190% from June 2023 highs.
At this pace, SOL has outpaced Bitcoin (BTC) and Ethereum (ETH), two of the world’s largest cryptocurrencies. This is despite Bitcoin, buoyed by the broader crypto’s optimism of the United States Securities and Exchange Commission (SEC) approving the first spot Bitcoin exchange-traded fund (ETF) in the coming weeks. The general confidence is despite the SEC laying out a potential timeframe for when this product will go live.
Looking at the SOL daily chart, primary support is around the November 2022 high at around $36–a key reaction line traders are closely monitoring. As it is, there has been a cool-off, but traders are confident of a pullback, pushing the coin back higher in a bullish breakout formation.
Is Fantom (FTM) Preparing For A 100% Surge?
Magnate, sharing the daily and weekly charts of FTM, noted that the coin appears to be bouncing off a critical support zone. In the weekly chart, the uptrend is defined. FTM is picking momentum, edging higher as confidence, partly due to fundamental events and the recovery across the board, is changing sentiment, propping bulls.
From the daily chart, FTM found support at 2022 lows before edging higher to spot rates. This leg up has catalyzed demand, lifting the coin 35% from October lows. Still, FTM is down approximately 65% from February 2023 highs.
Even so, only time will tell if FTM will track SOL, lifting off by over 100%, as the technical analyst predicts. Although there have been some challenges, there are also some positive developments taking place. One such development is that Messari, an analytics platform, recently observed a surge in Fantom’s on-chain activity.
According to their findings, the average number of new addresses added to the network daily increased by 106% in the last quarter. In comparison, the average number of active addresses per day rose by 3% in the same period.
Feature image from Canva, chart from TradingView
- SEO Powered Content & PR Distribution. Get Amplified Today.
- PlatoData.Network Vertical Generative Ai. Empower Yourself. Access Here.
- PlatoAiStream. Web3 Intelligence. Knowledge Amplified. Access Here.
- PlatoESG. Carbon, CleanTech, Energy, Environment, Solar, Waste Management. Access Here.
- PlatoHealth. Biotech and Clinical Trials Intelligence. Access Here.
- Source: https://www.newsbtc.com/fantom/fantom-explode-like-solana-analyst-bullish/
- :has
- :is
- $UP
- 1
- 2022
- 2023
- 35%
- a
- About
- across
- active
- activity
- added
- addresses
- All
- also
- Although
- an
- analyst
- analytics
- and
- appears
- approximately
- ARE
- around
- arrangement
- AS
- At
- average
- back
- BE
- been
- before
- binance
- Bitcoin
- board
- breakout
- broader
- BTC
- Bullish
- Bulls
- but
- by
- challenges
- Chance
- changing
- Chart
- Charts
- closely
- Coin
- coming
- coming weeks
- commission
- comparison
- confidence
- confident
- critical
- cryptocurrencies
- Currency
- daily
- day
- defined
- Demand
- Despite
- Development
- developments
- down
- due
- ecosystem
- ETF
- ETH
- ethereum
- ethereum (ETH)
- events
- exchange
- exchange-traded
- exchange-traded fund (ETF)
- fantom
- Fantom (FTM)
- February
- findings
- First
- follow
- For
- formation
- found
- from
- FTM
- fund
- fundamental
- General
- Go
- Hands
- Have
- High
- higher
- Highs
- HTTPS
- if
- image
- in
- increased
- IT
- june
- Key
- largest
- Last
- lifting
- like
- likely
- Line
- live
- looking
- losses
- Lows
- max-width
- May..
- Messari
- might
- missed
- Momentum
- monitoring
- native
- network
- New
- NewsBTC
- next
- noted
- November
- number
- october
- of
- off
- on
- On-Chain
- on-chain activity
- ONE
- only
- Optimism
- Optimistic
- out
- Outperform
- over
- Pace
- per
- perhaps
- period
- Place
- platform
- plato
- Plato Data Intelligence
- PlatoData
- positive
- potential
- Predicts
- preparing
- press
- Preview
- price
- primary
- Product
- pullback
- Pushing
- Quarter
- rally
- Rates
- reaction
- recovery
- remains
- ROSE
- Said
- same
- SEC
- Securities
- Securities and Exchange Commission
- sentiment
- September
- sharing
- So
- SOL
- Solana
- Solana (SOL)
- Solana Price
- SOLUSDT
- some
- Source
- specifically
- Spot
- States
- Still
- such
- support
- surge
- taking
- Technical
- tell
- that
- The
- The Weekly
- their
- There.
- Thinks
- this
- time
- timeframe
- to
- track
- Traders
- Trading
- TradingView
- trending
- true
- two
- United
- United States
- United States Securities and Exchange Commission
- uptrend
- upwards
- weekly
- Weeks
- when
- WHO
- will
- with
- world’s
- writing
- X
- zephyrnet


