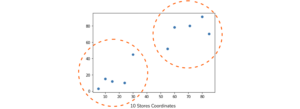
K-means clustering is an unsupervised learning algorithm that groups data based on each point euclidean distance to a central point called centroid. The centroids are defined by the means of all points that are in the same cluster. The algorithm first chooses random points as centroids and then iterates adjusting them until full convergence.
An important thing to remember when using K-means, is that the number of clusters is a hyperparameter, it will be defined before running the model.
K-means can be implemented using Scikit-Learn with just 3 lines of code. Scikit-learn also already has a centroid optimization method available, kmeans++, that helps the model converge faster.
To apply K-means clustering algorithm, let’s load the Palmer Penguins dataset, choose the columns that will be clustered, and use Seaborn to plot a scatterplot with color coded clusters.
Note: You can download the dataset from this link.
Let’s import the libraries and load the Penguins dataset, trimming it to the chosen columns and dropping rows with missing data (there were only 2):
import pandas as pd
import seaborn as sns
import matplotlib.pyplot as plt
from sklearn.cluster import KMeans

df = pd.read_csv('penguins.csv')
print(df.shape)
df = df[['bill_length_mm', 'flipper_length_mm']]
df = df.dropna(axis=0)
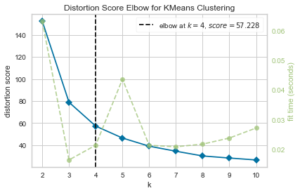
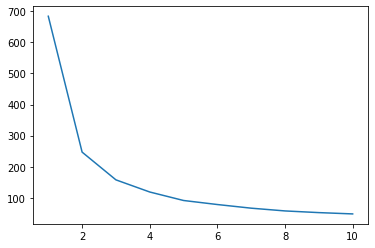
We can use the Elbow method to have an indication of clusters for our data. It consists in the interpretation of a line plot with an elbow shape. The number of clusters is were the elbow bends. The x axis of the plot is the number of clusters and the y axis is the Within Clusters Sum of Squares (WCSS) for each number of clusters:
wcss = []

for i in range(1, 11):
    clustering = KMeans(n_clusters=i, init='k-means++', random_state=42)
    clustering.fit(df)
    wcss.append(clustering.inertia_)

ks = [1, 2, 3, 4, 5, 6, 7, 8, 9, 10]
sns.lineplot(x = ks, y = wcss);
The elbow method indicates our data has 2 clusters. Let’s plot the data before and after clustering:
fig, axes = plt.subplots(nrows=1, ncols=2, figsize=(15,5))
sns.scatterplot(ax=axes[0], data=df, x='bill_length_mm', y='flipper_length_mm').set_title('Without clustering')
sns.scatterplot(ax=axes[1], data=df, x='bill_length_mm', y='flipper_length_mm', hue=clustering.labels_).set_title('Using the elbow method');
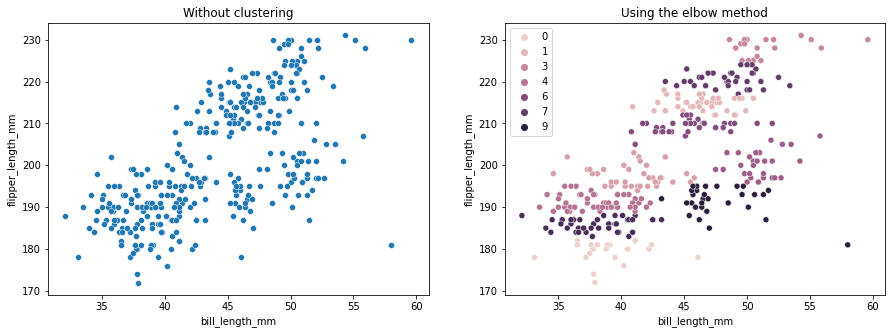
This example shows how the Elbow method is only a reference when used to choose the number of clusters. We already know that we have 3 types of penguins in the dataset, but if we were to determine their number by using the Elbow method, 2 clusters would be our result.
Since K-means is sensitive to data variance, let’s look at the descriptive statistics of the columns we are clustering:
df.describe().T
This results in:
 					count 	mean 		std 		min 	25% 	50% 	75% 	max
bill_length_mm 		342.0 	43.921930 	5.459584 	32.1 	39.225 	44.45 	48.5 	59.6
flipper_length_mm 	342.0 	200.915205 	14.061714 	172.0 	190.000 197.00 	213.0 	231.0
Notice that the mean is far from the standard deviation (std), this indicates high variance. Let’s try to reduce it by scaling the data with Standard Scaler:
from sklearn.preprocessing import StandardScaler

ss = StandardScaler()
scaled = ss.fit_transform(df)
Now, let’s repeat the Elbow method process for the scaled data:
wcss_sc = []

for i in range(1, 11):
    clustering_sc = KMeans(n_clusters=i, init='k-means++', random_state=42)
    clustering_sc.fit(scaled)
    wcss_sc.append(clustering_sc.inertia_)

ks = [1, 2, 3, 4, 5, 6, 7, 8, 9, 10]
sns.lineplot(x = ks, y = wcss_sc);
Check out our hands-on, practical guide to learning Git, with best-practices, industry-accepted standards, and included cheat sheet. Stop Googling Git commands and actually learn it!
This time, the suggested number of clusters is 3. We can plot the data with the cluster labels again along with the two former plots for comparison:
fig, axes = plt.subplots(nrows=1, ncols=3, figsize=(15,5))
sns.scatterplot(ax=axes[0], data=df, x='bill_length_mm', y='flipper_length_mm').set_title('Without cliustering')
sns.scatterplot(ax=axes[1], data=df, x='bill_length_mm', y='flipper_length_mm', hue=clustering.labels_).set_title('With the Elbow method')
sns.scatterplot(ax=axes[2], data=df, x='bill_length_mm', y='flipper_length_mm', hue=clustering_sc.labels_).set_title('With the Elbow method and scaled data');
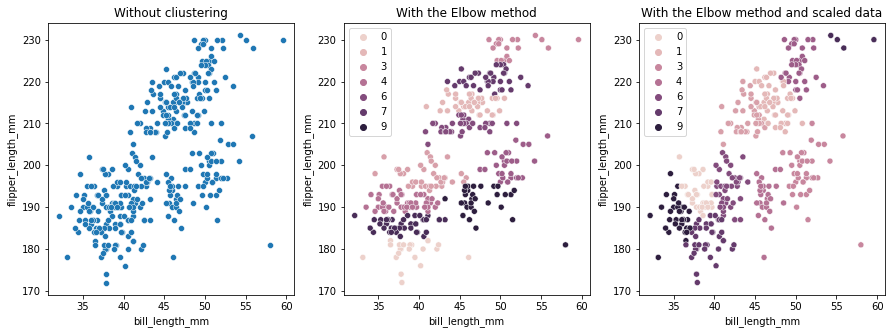
When using K-means Clustering, you need to pre-determine the number of clusters. As we have seen when using a method to choose our k number of clusters, the result is only a suggestion and can be impacted by the amount of variance in data. It is important to conduct an in-depth analysis and generate more than one model with different _k_s when clustering.
If there is no prior indication of how many clusters are in the data, visualize it, test it and interpret it to see if the clustering results make sense. If not, cluster again. Also, look at more that one metric and instantiate different clustering models – for K-means, look at silhouette score and maybe Hierarchical Clustering to see if the results stay the same.


