KAVA and Venus price action skews to support buyers. Even so, KAVA is generally firm above $5. On the other hand, losses below $25 may force the XVS coin lower.
The KAVA token primes the cross-chain DeFi platform.
Past Performance of KAVA
The KAVA token is resilient, shaking off sellers and snapping back to the primary trend.
Reading from the KAVA technical analysis, the coin is stretching gains versus the greenback on the last trading day, pointing to strength.
Day-Ahead and what to Expect
The primary trend is bullish, and KAVA/USDT traders appear to position themselves, expecting more gains.
In the immediate term, the primary resistance line stands at around $7.
A close above the rising wedge also opens up the coin to $7.5 and later $8.
Conversely, should bears take charge, a slip below $5 may mark the continuation of sellers set in motion by the October 27 bear bar.
KAVA Technical Analysis
The KAVA/USDT price is stable at the time of writing, fixed in an uptrend.
Overall, prices are inside a rising wedge, with caps at $7 and $5 on the downside.
Since the trend is clear, aggressive traders may search for loading points above $5 while setting sight on $7.5 and later $8.
If bears take charge, reversing recent gains, KAVA may dump to $4.5.
Venus (XVS)
The DeFi platform on the Binance Smart Chain (BSC) is an algorithmic money maker using XVS for governance.
Past Performance of XVS
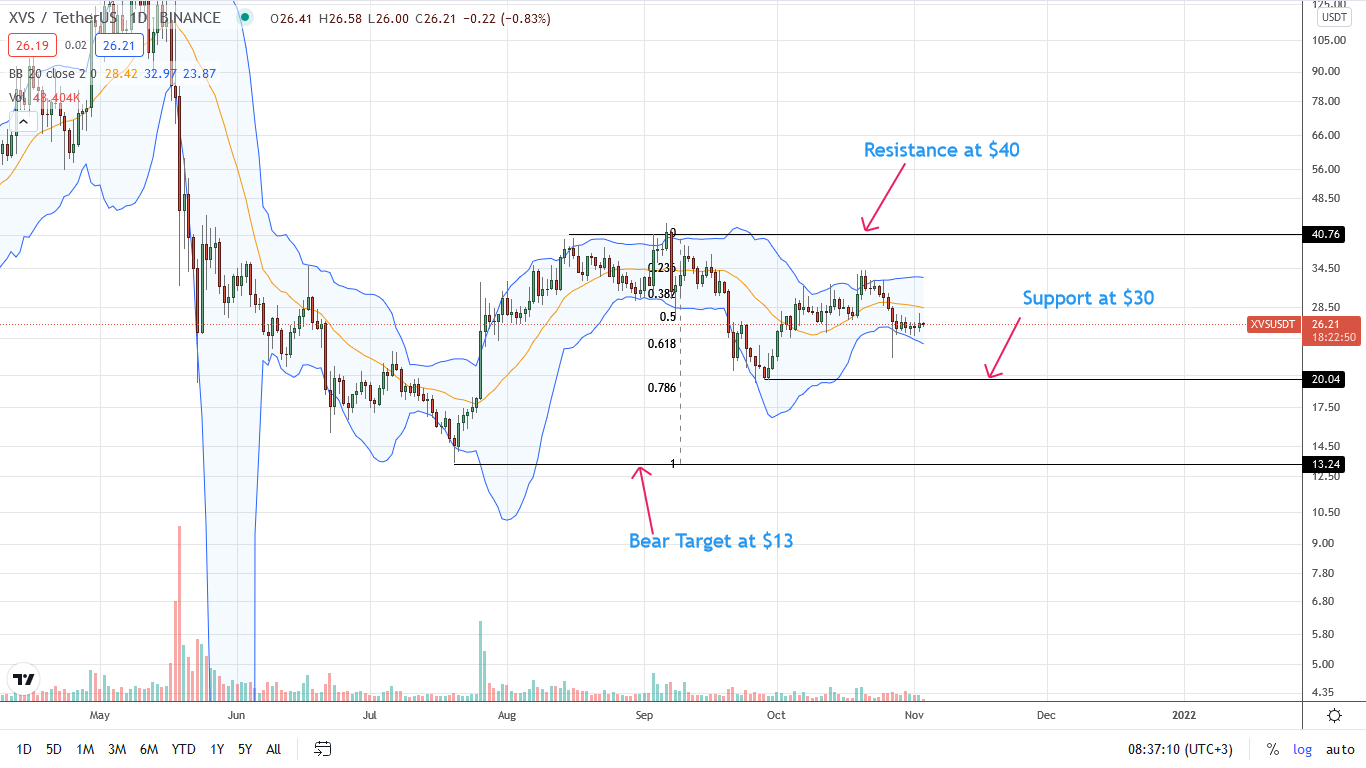
The Venus token is consolidating though momentum is picking up after November 2 bar.
There are signals of buyers taking charge as per the XVS technical analysis of the daily chart.
Day-Ahead and what to Expect
The Venus price is resilient, soaking bear attempts though the uptrend is labored.
Thus far, the XVS crypto has support at a critical Fibonacci level at around $25.
Even so, prices are trending inside the bear bar of October 27, pointing to weakness.
A sharp rebound in trading volumes may boost the XVS coin, pushing it to $35 and later $40.
Meanwhile, losses below $25 may confirm sellers of late October, bogging the bullish advance.
Venus Technical Analysis
The XVS/USDT price action skews to favor buyers.
With support at $25 and revival of November 2 potential flickers of demand, traders may load on dips aiming at immediate resistances at $35 and $40 to the upside.
Even so, a safe approach for risk-on traders is patient until November 2 gains are confirmed, preferably with a high volume, wide-ranging bar.
This may ignite demand, founding the base for another leg up.


