SNEAK PEEK
- LTC’s upward surge defies price struggles, indicating strong buyer support.
- Increasing market capitalization and trading volume reflect the growing interest in LTC.
- Bullish dominance fuels LTC’s rise, signaling optimism and potential for further gains.
Despite unsuccessful attempts to drive down prices, the positive momentum on the Litecoin (LTC) market has been robust over the last 24 hours. Support and resistance were seen at $85.44 and $93.16, respectively, throughout this upward price movement for LTC. This increase indicates that buyers are primarily among investors, and the market may soon resume its upward trend.
LTC has experienced a 5.49% increase compared to the previous closing price, reaching $91.24.
LTC’s market capitalization increased by 5.38% to $6,675,040,175, while its trading volume surged by 85.43% to $886,001,540, respectively, in the last 24 hours. This surge reflects interest in LTC as a potential investment strategy.
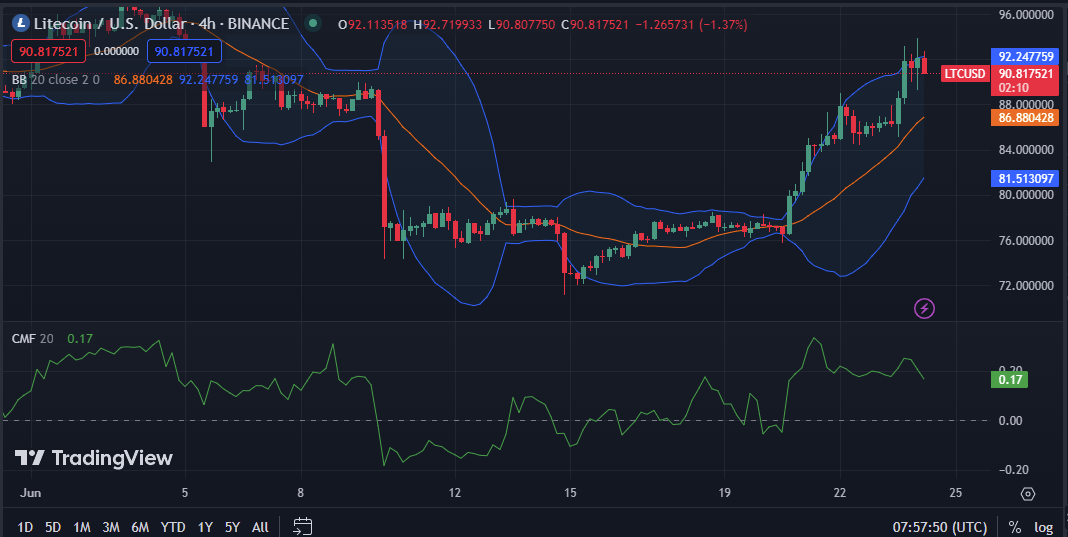
The Chaikin Money Flow (CMF) value of 0.17 in the LTC market, which is positive, may be a sign of the coin’s future performance being favorable. Since a positive CMF indicates that capital inflow exceeds capital outflow, investors are buying more LTC tokens than they are selling.
The Bollinger bands, which are bulging and have upper readings of 92.311676 and lower readings of 81.487657, show that the market is highly volatile. In the near future, traders should expect a substantial price fluctuation. The distance between the upper and lower bands of the LTC currency market is 9.175981, indicating a moderate level of market volatility.

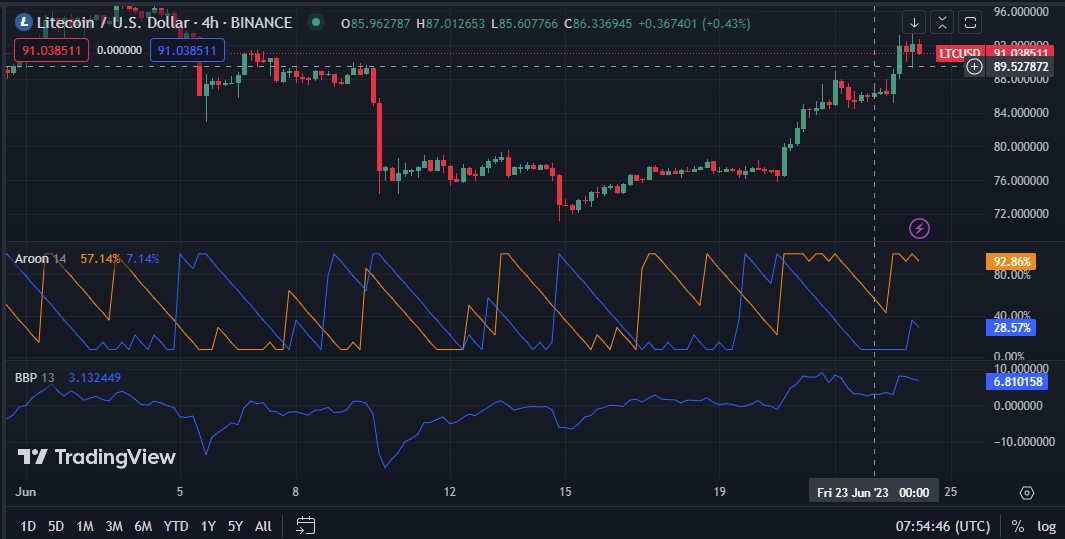
The market’s purchase power is just slightly more than its selling power, according to the Bull Bear Power value of 6.816576. With its increasing trend, the Bull Bear power assists traders in making informed decisions and accurately forecasting market patterns, leading to lucrative trades and improving confidence in their investing plans.
The figures for the Aroon up and down on the 4-hour price chart are 92.86% and 28.57%, respectively. This demonstrates that the trend is strong and is likely to continue for some time, despite the possibility of minor reversals or corrections along the way, allowing traders to pinpoint potential entry and exit opportunities for trades.

In conclusion, investors ride the bullish wave of LTC’s upward surge, anticipating further gains and capitalizing on growing market interest.
Disclaimer: Cryptocurrency price is highly speculative and volatile and should not be considered financial advice. Past and current performance is not indicative of future results. Always research and consult with a financial advisor before making investment decisions.
- SEO Powered Content & PR Distribution. Get Amplified Today.
- PlatoData.Network Vertical Generative Ai. Empower Yourself. Access Here.
- PlatoAiStream. Web3 Intelligence. Knowledge Amplified. Access Here.
- PlatoESG. Automotive / EVs, Carbon, CleanTech, Energy, Environment, Solar, Waste Management. Access Here.
- BlockOffsets. Modernizing Environmental Offset Ownership. Access Here.
- Source: https://investorbites.com/litecoin-ltc-price-analysis-24-06/
- :has
- :is
- :not
- $UP
- 16
- 17
- 22
- 24
- 28
- 9
- a
- According
- accurately
- advice
- advisor
- Allowing
- along
- always
- among
- analysis
- and
- anticipating
- ARE
- AS
- assists
- At
- Attempts
- BE
- Bear
- been
- before
- being
- between
- Bollinger bands
- bull
- Bullish
- BUYER..
- buyers
- Buying
- by
- capital
- capitalization
- capitalizing
- Chart
- closing
- compared
- conclusion
- confidence
- considered
- continue
- Corrections
- Currency
- Current
- decisions
- demonstrates
- Despite
- distance
- Dominance
- down
- drive
- entry
- exceeds
- Exit
- expect
- experienced
- Figures
- financial
- financial advice
- flow
- fluctuation
- For
- forecasts
- frenzy
- fuels
- further
- future
- Gains
- Growing
- growing interest
- Have
- highly
- HOURS
- HTTPS
- improving
- in
- Increase
- increasing
- indicates
- informed
- interest
- internal
- investing
- investment
- Investment strategy
- investor
- Investors
- ITS
- just
- Last
- leading
- Level
- likely
- Litecoin
- Litecoin (LTC)
- Litecoin price
- Litecoin price analysis
- lower
- LTC
- LTC/USD
- lucrative
- Making
- Market
- Market Capitalization
- Market News
- market volatility
- May..
- minor
- Momentum
- money
- more
- movement
- Near
- news
- of
- on
- opportunities
- Optimism
- or
- over
- past
- patterns
- performance
- plans
- plato
- Plato Data Intelligence
- PlatoData
- positive
- possibility
- potential
- power
- previous
- price
- Price Analysis
- price chart
- Prices
- primarily
- promising
- purchase
- reaching
- reflect
- reflects
- research
- Resistance
- respectively
- Results
- resume
- Ride
- Rise
- robust
- seen
- Selling
- should
- show
- sign
- since
- some
- soon
- Source
- Sparks
- speculative
- Strategy
- strong
- Struggles
- substantial
- support
- surge
- Surged
- than
- that
- The
- their
- they
- this
- throughout
- time
- to
- Tokens
- Traders
- trades
- Trading
- trading volume
- TradingView
- Trend
- upward
- value
- volatile
- Volatility
- volume
- Wave
- Way..
- were
- which
- while
- with
- zephyrnet


