TL;DR Breakdown
- The Litecoin price analysis is bearish.
- Support for LTC/USD is present at $111.3.
- Next, resistance is present at $114.
The Litecoin price analysis shows a bearish trend for today. The bears have taken over the price charts once again and have reduced the price level to 112.1, as market sentiment is bearish towards LTC/USD. Selling pressure came in at the start of today’s trading session, but the trend remained undetermined during the first four hours, and after that, bears outplayed the bulls. The price trend line shows a downwards curve from 31st March after the price last peaked at $131.2 on 30th March. Today the price movement is slow towards the downside as the next support is also nearby at the $111.3 level.
LTC/USD 1-day price chart: Do bulls stand any chance?
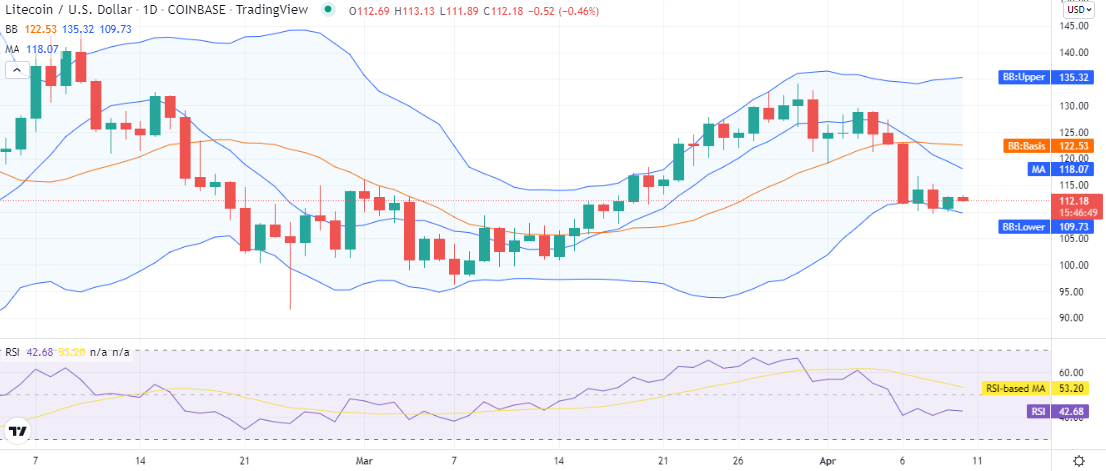
The 1-day price chart for Litecoin price analysis shows the price breakup was downwards today and continues to go down as of now, and the LTC/USD pair is trading hands at 112.1 at the time of writing. The price trend was downwards during the entire last week, and today the price seems to be sliding sideways. The trading volume is also down by 39.21 percent today, and overall the coin is at a loss of 11 percent if observed over the past week.

The volatility is increasing for LTC/USD as the Bollinger bands are expanding with the upper bank of the indicator readjusting itself to $135, and the lower band has come down to $109.7 representing support for LTC as the price is trading near the lower band. The mean average line of the Bollinger bands is still above the price level at the $122 mark.
The relative strength index (RSI) is hovering in the neutral zone. The RSI started moving downwards after the 4th April and has stepped down into the lower half of the neutral zone during the past few days. RSI is present at index 42 but sinking slowly, indicating a selling activity gaining strength in the market.
Litecoin price analysis: Recent developments and further technical indications
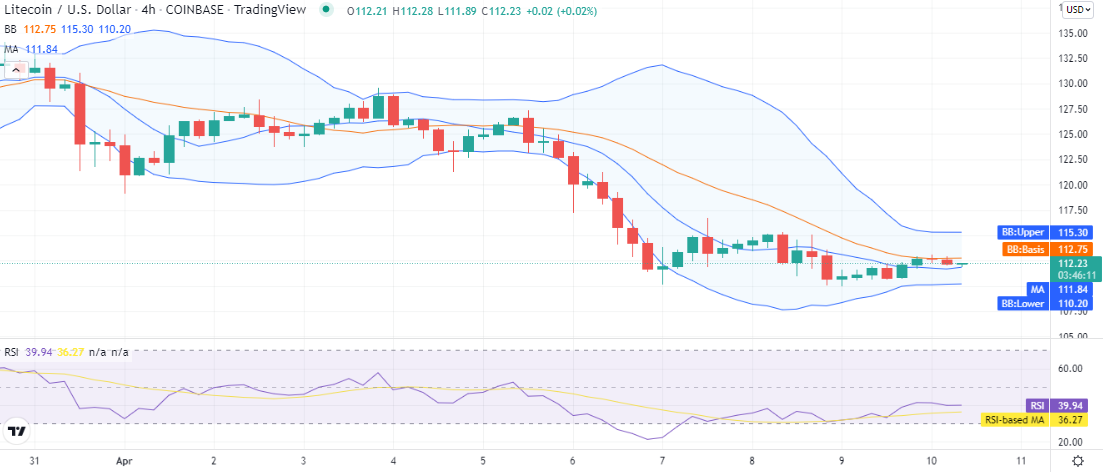
The 4-hour price chart for Litecoin price analysis shows a continuous degradation of price, and no considerable bullish effort has been observed today. The last candlestick appearing on the 4-hour chart is green but may also turn red soon as the volatility for LTC has decreased significantly since 9th April limiting the price movement.

The moving average (MA) is also showing some bearish traits as it is trading above the price level on the 4-hour chart and below the SMA 50 curve, which authenticates the bearish dominance. The volatility is quite low on the 4-hour chart as the Bollinger bands have formed a narrow channel hinting at the less price movement for the coming hours.
The relative strength index (RSI) is moving horizontally, indicating some resistance from the bullish side, but if the RSI dips, it will be an indication that the price to decrease further in the coming hours.
Litecoin price analysis: Conclusion
The Litecoin price analysis suggests, that the bulls seem unable to hold an impactful momentum after 31st March since the downtrend has started, so the price levels can be expected to decrease in the coming days. For intraday trading, the bears can overwhelm bulls further at any time as the balance of power is also on the bearish side.
Disclaimer. The information provided is not trading advice. Cryptopolitan.com holds no liability for any investments made based on the information provided on this page. We strongly recommend independent research and/or consultation with a qualified professional before making any investment decisions.
- 11
- 39
- 7
- activity
- advice
- analysis
- April
- arrests
- authenticates
- average
- Bank
- bearish
- Bearish Momentum
- Bears
- Bullish
- Bulls
- Charts
- Coin
- come
- coming
- continues
- curve
- developments
- down
- expanding
- expected
- First
- function
- further
- Green
- hold
- holds
- HTTPS
- increasing
- index
- information
- investment
- Investments
- IT
- itself
- Level
- liability
- Line
- Litecoin
- Litecoin price
- LTC
- LTC/USD
- made
- Making
- March
- mark
- Market
- Momentum
- movement
- moving
- Near
- power
- present
- pressure
- price
- Price Analysis
- professional
- qualified
- recommend
- remained
- research
- sentiment
- So
- some
- start
- started
- support
- Technical
- time
- today
- towards
- Trading
- Volatility
- volume
- week
- writing


