Published 11 mins ago
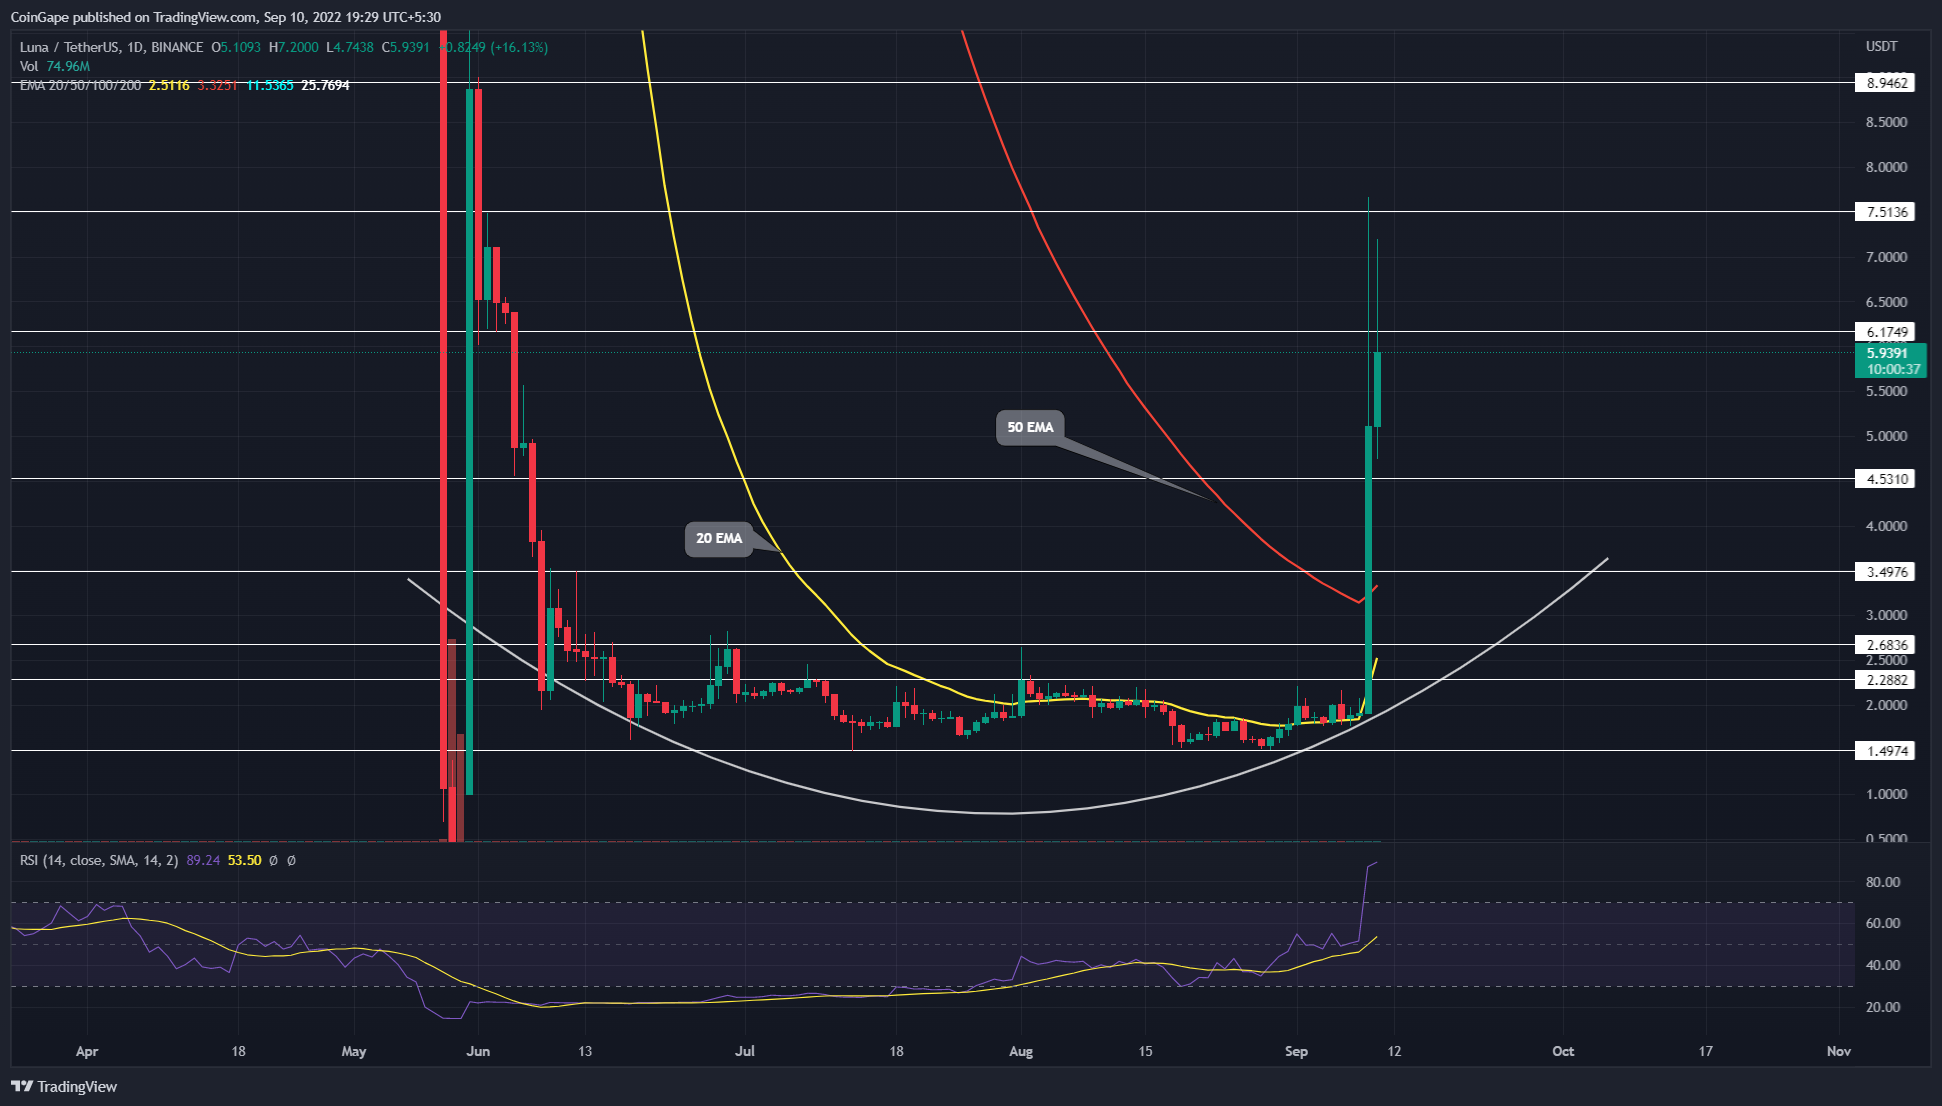
Following a long accumulation, the LUNA price surged significantly in the last two days. Moreover, the technical chart justifies this price action with a rounding bottom pattern in the daily time frame. This bullish reversal pattern should encourage buyers to extend the recovery above $9. However, is it safe to enter now?
advertisement
Key points
- The rounding bottom pattern governs the LUNA price action
- The LUNA buyers currently struggle to surpass the $7.5 resistance
- The intraday trading volume in the LUNA coin is $5.7 Billion, indicating a 69.5% gain.

 Source- Tradingview
For the past three months, the LUNA/USDT pair consolidated in a narrow range from $2.68 to $1.5. The multiple retests to the lower support indicate the traders are actively buying at this support, forming a high accumulation zone.
Furthermore, as the Terra community is planning for a resurgence, the Terra tokens are experiencing significant inflow. Thus, the LUNA price surged perpendicularly and marked a high at $7.65
Trending Stories
Thus, the bull run registered a 212% growth in just two days. However, both the daily candles showed high-wick rejection near the $7.5 mark, suggesting strong profit booking at this level.
In addition, such sudden recovery in a short span is considered unhealthy for an assistant. Therefore, a minor consolidation or retracement is needed to stabilize the LUNA price.
Therefore, if the prices revert lower, the Fibonacci retracement level suggests that $5.3(0.382) and $4.53(0.5 FIB) may act as a significant footing that could continue the bull run. Thus, the coin chart reveals a rounding bottom pattern, and under its influence, the LUNA price should surge to the $9 neckline.
Conversely, if the LUNA price dips below $4.53 support, the bullish momentum will start to weaken gradually.
Technical Indicator
Relative strength index: the daily-RSI slope spiked into the 90% mark suggesting the traders have overextended their buying activity. Thus, the momentum indicator bolstered the correction theory mentioned above.
advertisement
EMAs: the ongoing recovery breached the 20-and-50-day EMA in one strike. During the potential correction, these EMAs could assist buyers in resuming the bullish growth.
- Resistance levels- $6.2, and $7.5
- Support levels- $5.3 and $4.5
Share this article on:
The presented content may include the personal opinion of the author and is subject to market condition. Do your market research before investing in cryptocurrencies. The author or the publication does not hold any responsibility for your personal financial loss.
- Bitcoin
- blockchain
- blockchain compliance
- blockchain conference
- coinbase
- Coingape
- coingenius
- Consensus
- crypto conference
- crypto mining
- cryptocurrency
- decentralized
- DeFi
- Digital Assets
- ethereum
- machine learning
- non fungible token
- plato
- plato ai
- Plato Data Intelligence
- Platoblockchain
- PlatoData
- platogaming
- Polygon
- Price Analysis
- proof of stake
- Terra (LUNA)
- terra price analysis
- W3
- zephyrnet


