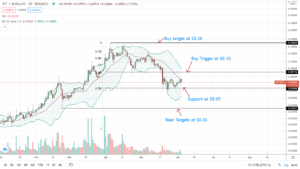
The 10% free-fall to the $50 support zone within the triangle showcases the rise in the underlying bearishness. Will the LUNA coin price breach $50? The LUNA coin price action forms a symmetrical triangle pattern with the recent reversal to surpass the resistance trendline, resulting in a lower high formation. However, the bullish candle forming near the $50 horizontal zone teases a bullish reversal within the triangle pattern. Will the Terra coin price give a bearish fallout? Key technical points: The coin price shows a free fall to the $50 mark. The stochastic RSI indicator shows a bearish crossover of the K and D lines. The 24-hour trading volume in the Terra token is $1.28 Billion, indicating a 30% rise. Past Performance of LUNA As Bitcoin falls below the $41K mark, most altcoins get the bearish influence resulting in an overnight downfall. The LUNA coin price fell 10.30% last night, resulting in a sudden reversal to the $50 support zone. Currently, the market price of the Terra token is $51.13, with a rise of 1.68% in the freshly forming daily candle in the support zone. Source-Tradingview LUNA Technical Analysis The LUNA coin price forms a symmetrical triangle pattern with the market price near the support trendline. Therefore, traders can expect a bullish reversal to the resistance trendline to continue resonating within the pattern. The crucial 200-day EMA provides support to the falling price and helps maintain the uptrend in action. However, the 50 and 100-day EMA maintains a negative slope and hints of a bearish crossover. The RSI Indicator slope succumbs below the 50% mark, and the 14-day SMA as the bears take over the trend. However, the long-coming sideways movement project the weakness in the underlying bulls. The Stochastic RSI indicator projects a bearish crossover of the K and D lines in the overbought zone. Moreover, the falling slope of the lines indicates the start of a bear cycle in the LUNA/USD chart. In short, the technical indicators indicate the high possibility of a bearish breakdown of the symmetrical triangle. Upcoming Trend The LUNA coin price shows the bears overtaking the trend control and a possible bearish continuation below the $45 mark. However, traders need to wait for the price action confirmation to avoid any bear trap. Support Levels: $45 and $35 Resistance Levels: $60 and $67
The post LUNA Technical Analysis: Bears Soon To Outgrow Symmetrical Triangle appeared first on Cryptoknowmics-Crypto News and Media Platform.
- "
- Action
- Altcoins
- analysis
- bearish
- Bears
- Billion
- Bitcoin
- breach
- Bullish
- Bulls
- Coin
- continue
- control
- crucial
- Display
- EMA
- fallout
- First
- forms
- Free
- helps
- High
- HTTPS
- influence
- Key
- mark
- Market
- Media
- most
- movement
- Near
- news
- Pattern
- performance
- possibility
- possible
- price
- project
- projects
- provides
- Short
- start
- support
- Symmetrical Triangle
- Technical
- Technical Analysis
- Terra
- token
- Traders
- Trading
- volume
- wait
- within


