- Terra Classic reaches a new milestone by burning 15 million tokens in a week, with more burning on the cards.
- LUNC experiences consolidation after each drop, with increasing bearish pressure.
- The 200-day MA is a formidable fortress. LUNC may rebound in the absence of bulls’ aggression.
The Terra Classic (LUNC) community burned over 226 million LUNC tokens in January. The burning was a response to Binance’s announcement to delay sending LUNC trading fees to the burn address until March 2023. Despite all that, LUNC has still been seen struggling in the red zone.
The token’s community burned over 226 million LUNC tokens in January. Much more fascinating is the fact that LUNC reached a new milestone of burning 15 million tokens in a week compared to the 12 million burned in early January. Furthermore, the community aims to burn more in 2023.
Binance recently announced the delay of their burning mechanism for LUNC until March 2023.
The move comes following the developments related to Proposal 10983 and Proposal 11111 to fund the commodity pool. Moreover, Binance will burn 50% of LUNC spot and margin trading fees instead of 100% after implementing the changes to its burning mechanism.
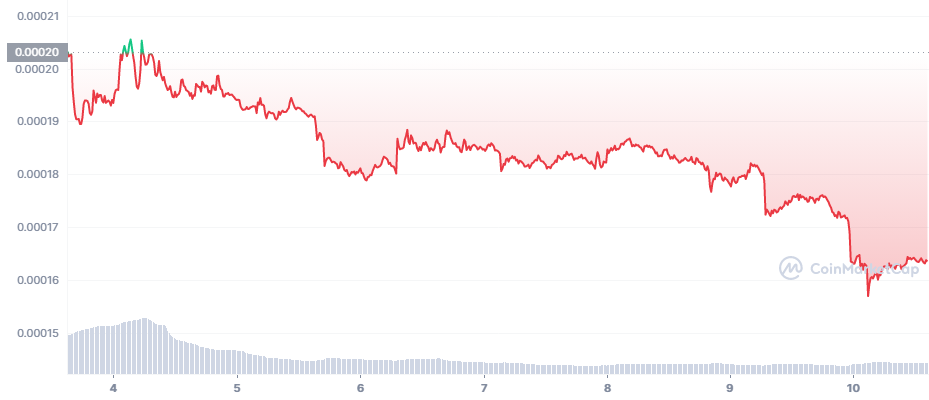
Meanwhile, when considering the chart below, LUNC has been struggling in the red zone with an opening market price of $0.00021. Although for the first two and half days, LUNC was fluctuating in a tight range between $0.00019 and $0.00021, the bears instilled their power, and the prices started to drop even further.
On the third day, LUNC tanked from $0.000191 to $0.000179 within a few hours and started moving sideways. Its movement was constrained between a tight range of $0.00017 and $0.00019 until the sixth day. However, on the seventh day, LUNC tanked further and reached its lowest price of $0.000156.

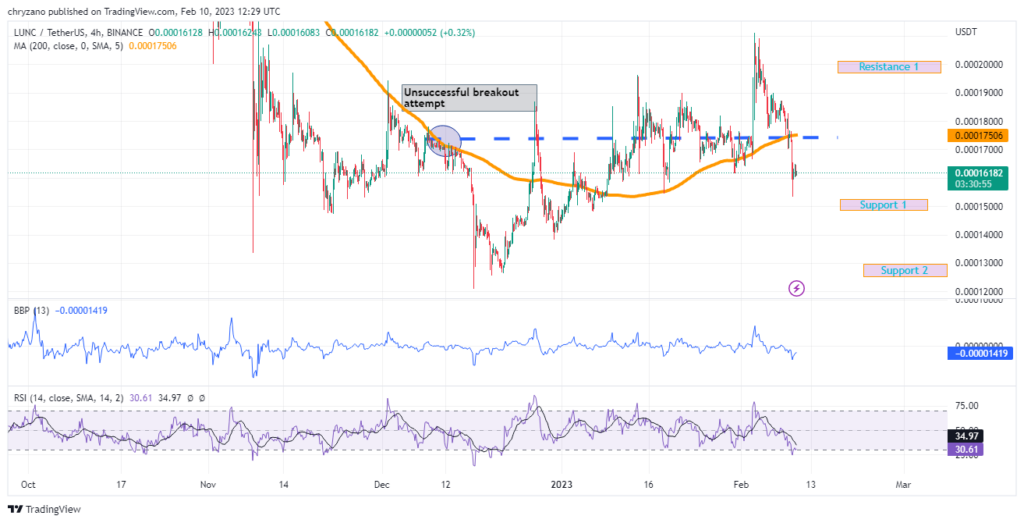
When considering the chart below, the 200-MA has been an unbreakable fortress from up above and down below. The chart below shows (blue elliptical) how LUNC struggled to break the 200-day MA from below despite the bear-bull power reaching above zero (0.00000789) at times.
Currently, the 200-day MA is positioned at a similar position as it was during December. The BBP is in the negative zone indicating a value of -0.00001457. However, the RSI is in the overbought recording at 29.54, and it is tilting downwards. From an optimistic point of view, the market could correct the prices, and LUNC could rise.

Despite being in the negative zone the BBP indicator is titled towards to positive area, hence, it gives the traders holding a long position, a glimmer of hope.
Will the bulls be strong enough to break the formidable 200-day MA or will LUNC rebound as during the previous time? Will the bears take LUNC deeper into the mire and make it tank to support 2? Time will tell when the market decides.
Disclaimer: The views and opinions, as well as all the information shared in this price analysis, are published in good faith. Readers must do their own research and due diligence. Any action taken by the reader is strictly at their own risk, Coin Edition and its affiliates will not be held liable for any direct or indirect damage or loss.
Post Views: 13
- SEO Powered Content & PR Distribution. Get Amplified Today.
- Platoblockchain. Web3 Metaverse Intelligence. Knowledge Amplified. Access Here.
- Source: https://coinedition.com/lunc-in-dire-straits-despite-token-burning-can-the-bulls-rescue/
- 2023
- a
- above
- Action
- address
- affiliates
- After
- aims
- All
- Although
- analysis
- and
- announced
- Announcement
- AREA
- bearish
- Bears
- being
- below
- between
- binance
- Blue
- Break
- Bulls
- burn
- Cards
- Changes
- Chart
- classic
- Coin
- Coin Edition
- CoinMarketCap
- commodity
- community
- compared
- considering
- consolidation
- could
- day
- Days
- December
- delay
- Despite
- developments
- diligence
- dire
- direct
- down
- Drop
- during
- each
- Early
- edition
- enough
- Even
- Experiences
- fascinating
- Fees
- few
- First
- following
- formidable
- Fortress
- from
- fund
- further
- Furthermore
- gives
- good
- Half
- Held
- holding
- hope
- HOURS
- How
- However
- HTTPS
- implementing
- in
- increasing
- Indicator
- information
- instead
- IT
- January
- Long
- loss
- LUNC
- make
- March
- Margin
- margin trading
- Market
- max-width
- mechanism
- milestone
- million
- more
- move
- movement
- moving
- negative
- New
- opening
- Opinions
- Optimistic
- own
- plato
- Plato Data Intelligence
- PlatoData
- Point
- Point of View
- pool
- position
- positioned
- positive
- power
- pressure
- previous
- price
- Price Analysis
- Prices
- proposal
- published
- range
- reached
- Reaches
- reaching
- Reader
- readers
- rebound
- recently
- recording
- Red
- related
- rescue
- research
- response
- Rise
- Risk
- rsi
- sending
- shared
- Shows
- sideways
- similar
- sixth
- Source
- Spot
- started
- Still
- strong
- Struggling
- support
- Take
- Tanked
- Terra
- Terra Classic
- The
- the information
- their
- Third
- time
- times
- titled
- to
- token
- token burning
- Tokens
- towards
- Traders
- Trading
- Trading Fees
- TradingView
- value
- View
- views
- week
- will
- within
- zephyrnet
- zero


