Published 2 days ago
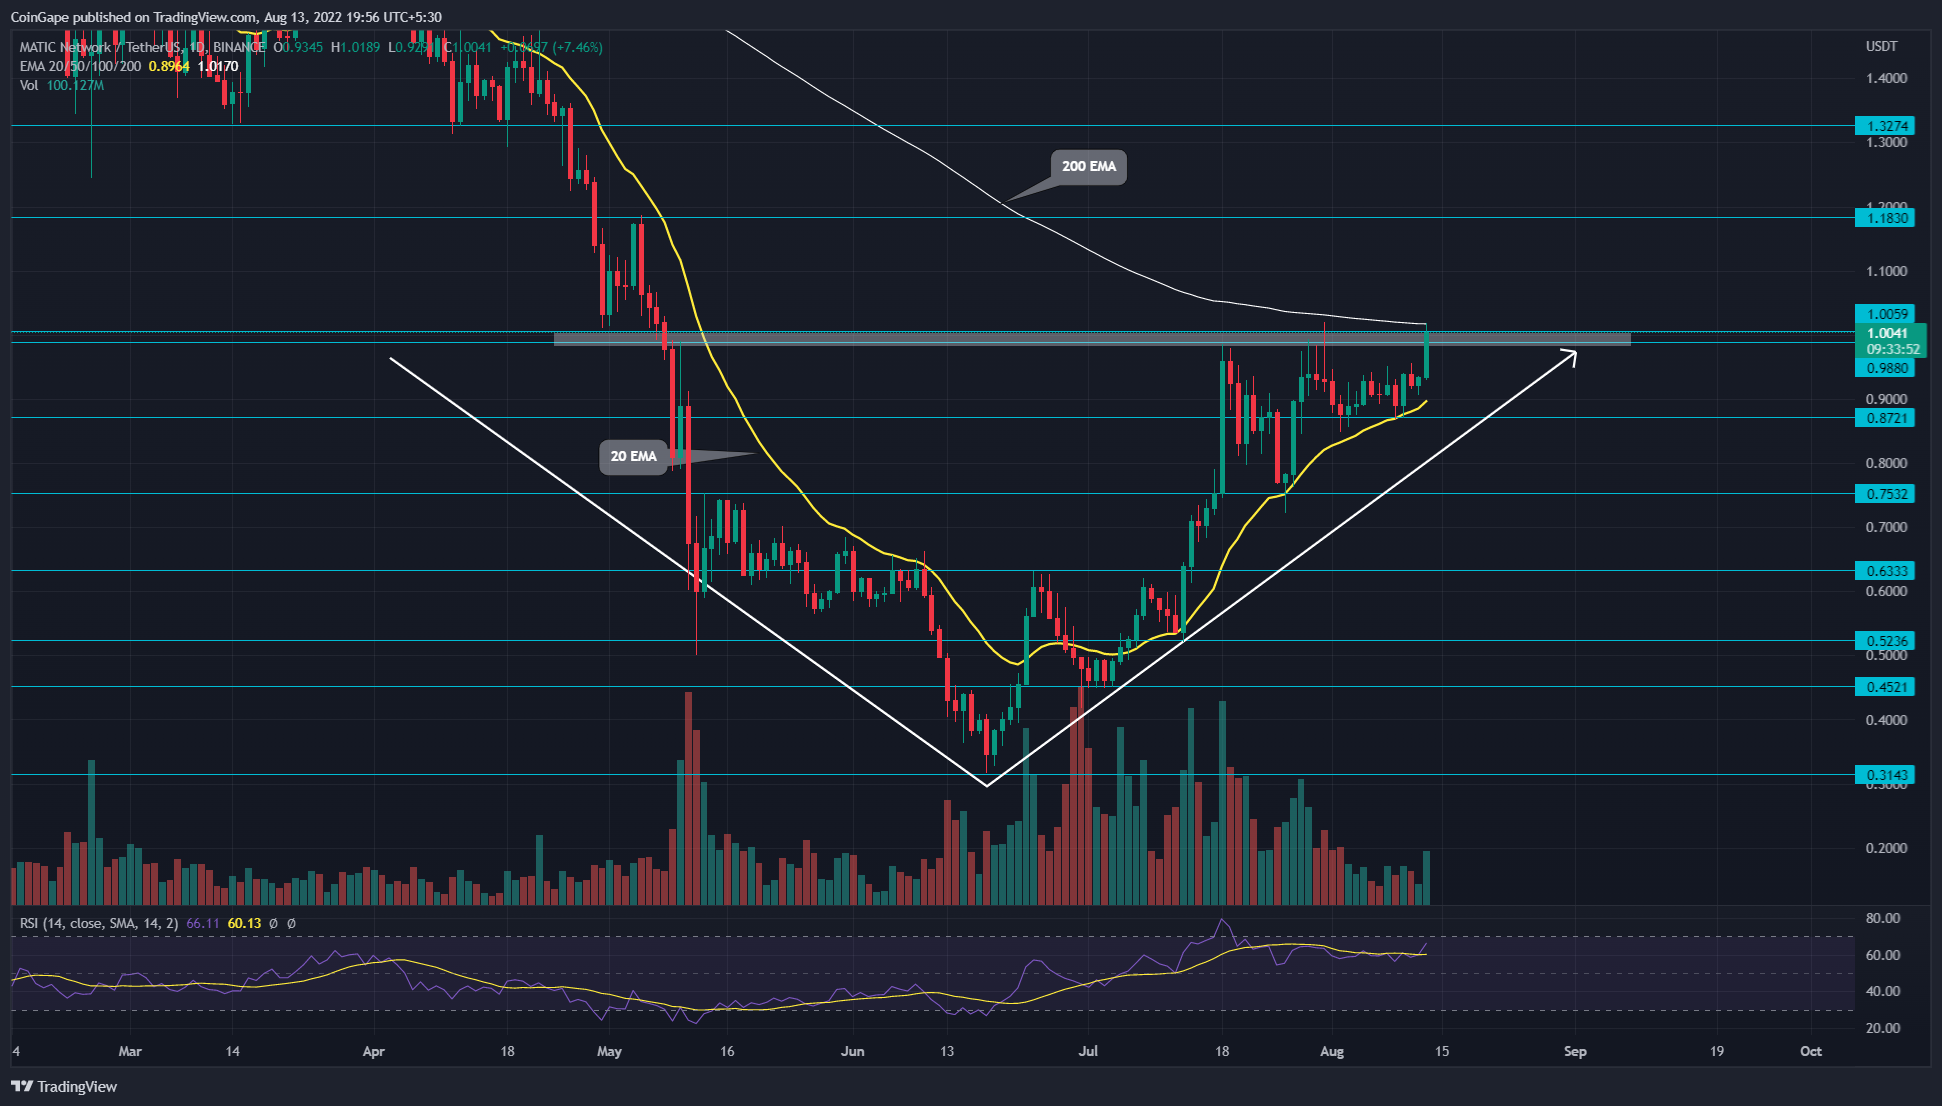
A V-shaped recovery initiated from the $0.31 low surged the MATIC/USDT pair 212% as it hit the $1 mark. Furthermore, the rising volume activity during the bull run showcased a genuine recovery rally that hit the $1 psychological resistance. However, the buyers struggle to surpass this barrier, indicating a make or breakout situation for coin holders.
advertisement
Key points
- The $1 resistance breakout would boost the bullish momentum.
- The 50-and-100-day EMA closing a bullish crossover may provide additional confirmation for a $1 breakout
- The intraday trading volume in the MATIC is $920.2 Million, indicating a 12.51% gain

 Source- –Tradingview
Today, the MATIC price pumped 6.57% and attempted to breach the $1 resistance. Furthermore, the altcoin is retesting this barrier for the third time since last month, indicating the sellers are aggressively defending this level.
However, the higher low formation while the price hits the $1 mark indicates growth in bullish momentum. Taking another approach, the decreasing volume activity during this consolidation indicates less possibility of bearish reversal.
Trending Stories
Thus, the technical analysis indicates that MATIC price should reclaim the $1 mark. Anyhow, a daily candlestick above the combined resistance of $1 psychological level and 200-day EMA is needed to confirm this breakout.
If the buyers succeeded, the MATIC price would obtain a significant milestone to bolster trend reversal. The post breakout rally may drive the coin price 17.5% higher to the next supply zone at $11.8.
While this looks bullish for MATIC price, if the sellers wrestle trend control from buyers and revert the price from the $1 mark, a breakdown from the $0.872 or dynamic support 20-day will trigger a significant correction.
Technical Indicators
EMAs: the 200-day EMA wavering around $1 offers an additional line of defense against buyers. However, traders can maintain positive positions as long as the 20-day EMA remains intact.
advertisement
Relative Strength Index: the daily RSI plunged lower but sustained above the midline amid the current consolidation in price action, indicating the traders remain bullish for MATIC.
- Resistance levels- $1 and $1.18
- Support levels- $0.87 and $0.75
Share this article on:
The presented content may include the personal opinion of the author and is subject to market condition. Do your market research before investing in cryptocurrencies. The author or the publication does not hold any responsibility for your personal financial loss.
- Bitcoin
- blockchain
- blockchain compliance
- blockchain conference
- coinbase
- Coingape
- coingenius
- Consensus
- crypto conference
- crypto mining
- cryptocurrency
- decentralized
- DeFi
- Digital Assets
- ethereum
- machine learning
- non fungible token
- plato
- plato ai
- Plato Data Intelligence
- Platoblockchain
- PlatoData
- platogaming
- Polygon
- Polygon (MATIC)
- Polygon price analysis
- Price Analysis
- proof of stake
- W3
- zephyrnet


