SNEAK PEEK
- PEPE’s positive momentum persists despite reaching an all-time high.
- Bollinger bands indicate high volatility and the possibility of significant price fluctuations.
- MFI shows intense buying pressure and a probable continuation of the rising trend.
According to a recent tweet on May 5th, PEPE had dropped 20% after retesting its uptrend breakdown. However, after launching PEPE on BitMEX, it attracted attention from investors, all of which led to its fantastic surge. As a result, bulls dominated the PEPE market In the past 24 hours, steering the PEPE price from a 24-hour low of $0.000001278 to an all-time high of $0.000002322 before facing resistance.
Down 20% from uptrend breakdown retest last night 👀 https://t.co/NLJgiN0QPe pic.twitter.com/hU43Q0c2r0
— Nebraskangooner (@Nebraskangooner) May 3, 2023
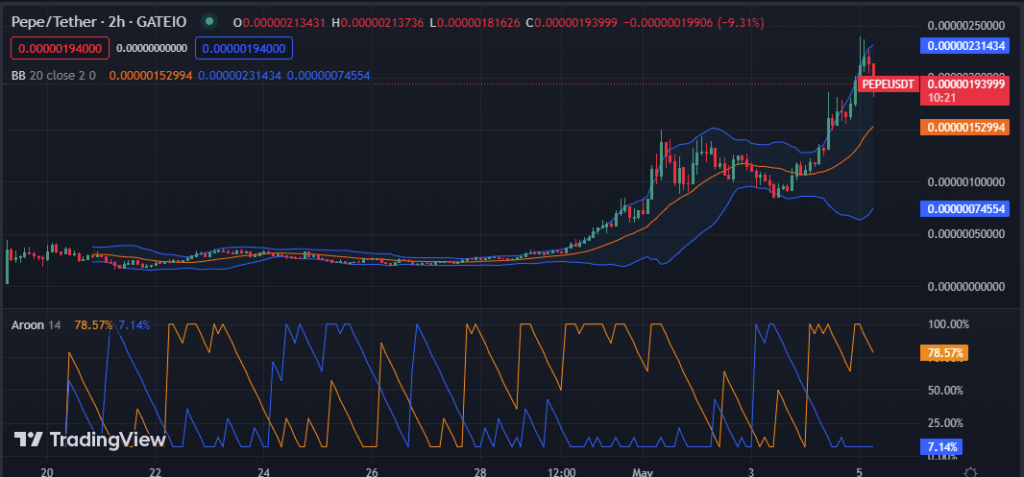
As of this writing, the price increased by 59.00% to $0.000001912 due to the continuous positive trend.
PEPE’s market capitalization increased to $795,635,444 and 24-hour trading volume increased by 237.64% to $750,150,233, respectively. This surge suggests that traders are anticipating the PEPE bull rally to prevail hence the increase in the buying and selling in the market.
A significant level of market volatility is indicated by the widened Bollinger bands, which have upper values of 0.000002307 and lower readings of 0.0000007474. This motion indicates a high likelihood of significant price fluctuations in either direction and that the asset’s price fluctuates quickly.
On the 2-hour price chart of the PEPE market, the values for the Aroon up and down are 78.87% and 7.14%, respectively. This movement shows that the trend is solid and likely to continue for a while, enabling traders to identify probable entry and exit opportunities for trades, even though there may be minor reversals or corrections.

The Commodity Channel Index (CCI), which currently has a value of 83.56, is moving upward. This level indicates that PEPE’s current price is much higher than its average price, indicating a possible overbought condition. Nevertheless, PEPE will probably increase soon since purchasers control the market and increase prices.
On the 2-hour price chart of the PEPE market, the Money Flow Index (MFI) is optimistic, with a value of 74.52. This MFI level suggests that buying pressure is higher than selling pressure, backing the positive trend anticipated in the PEPE market.

In conclusion, PEPE is showing bullish signs, with intense buying pressure and its indicators all pointing to a potential surge. Traders should watch for entry and exit points to maximise their profits.
Disclaimer: Cryptocurrency price is highly speculative and volatile and should not be considered financial advice. Past and current performance is not indicative of future results. Always research and consult with a financial advisor before making investment decisions.
- SEO Powered Content & PR Distribution. Get Amplified Today.
- PlatoAiStream. Web3 Data Intelligence. Knowledge Amplified. Access Here.
- Minting the Future w Adryenn Ashley. Access Here.
- Buy and Sell Shares in PRE-IPO Companies with PREIPO®. Access Here.
- Source: https://investorbites.com/pepe-coin-pepe-price-analysis-05-05/
- :has
- :is
- :not
- $UP
- 22
- 24
- 7
- a
- advice
- advisor
- After
- All
- always
- an
- analysis
- and
- Anticipated
- anticipating
- ARE
- AS
- attention
- attracted
- average
- backing
- BE
- before
- BitMEX
- Bollinger bands
- Breakdown
- bull
- Bullish
- Bulls
- Buying
- by
- capitalization
- Center
- Channel
- Chart
- Coin
- commodity
- conclusion
- condition
- considered
- continuation
- continue
- continuous
- control
- Corrections
- Current
- Currently
- decisions
- Despite
- direction
- Dominate
- down
- dropped
- due
- either
- enabling
- entry
- Even
- Exit
- external
- facing
- fantastic
- financial
- financial advice
- flow
- fluctuates
- fluctuations
- For
- from
- future
- had
- Have
- hence
- High
- higher
- highly
- HOURS
- However
- HTTPS
- identify
- in
- Increase
- increased
- index
- indicate
- indicated
- indicates
- Indicators
- internal
- investment
- Investors
- IT
- ITS
- Last
- launching
- Led
- Level
- likely
- Low
- lower
- Making
- Market
- Market Capitalization
- Market News
- market volatility
- max-width
- May..
- minor
- Momentum
- money
- motion
- movement
- moving
- much
- Nevertheless
- news
- night
- of
- on
- opportunities
- Optimistic
- or
- past
- performance
- persists
- plato
- Plato Data Intelligence
- PlatoData
- points
- positive
- possibility
- possible
- potential
- pressure
- price
- Price Analysis
- price chart
- Price Fluctuations
- Prices
- probably
- profits
- quickly
- rally
- reaching
- recent
- research
- Resistance
- respectively
- result
- Results
- rising
- Selling
- should
- Shows
- significant
- Signs
- since
- solid
- Source
- Suggests
- surge
- Surges
- than
- that
- The
- their
- There.
- this
- though?
- to
- Traders
- trades
- Trading
- trading volume
- TradingView
- Trend
- tweet
- uptrend
- upward
- value
- Values
- volatile
- Volatility
- volume
- Watch
- which
- while
- will
- with
- writing
- zephyrnet


