TL;DR Breakdown
- The Polkadot price analysis is bearish.
- Resistance for DOT is present at the $18.1 level.
- Support for DOT is present at $16.9.
The Polkadot price analysis suggests the coin is bearish today, as the price has decreased further. DOT continued downside below $17.7 as the coin faced rejection at $17.9 point today when the bulls tried to take over the price function, and the price oscillated back to $17.1. Bullish efforts were again observed during the day, but the bearish stroke was overwhelming, which turned the trend in favor of sellers, and the selling pressure may appear again.
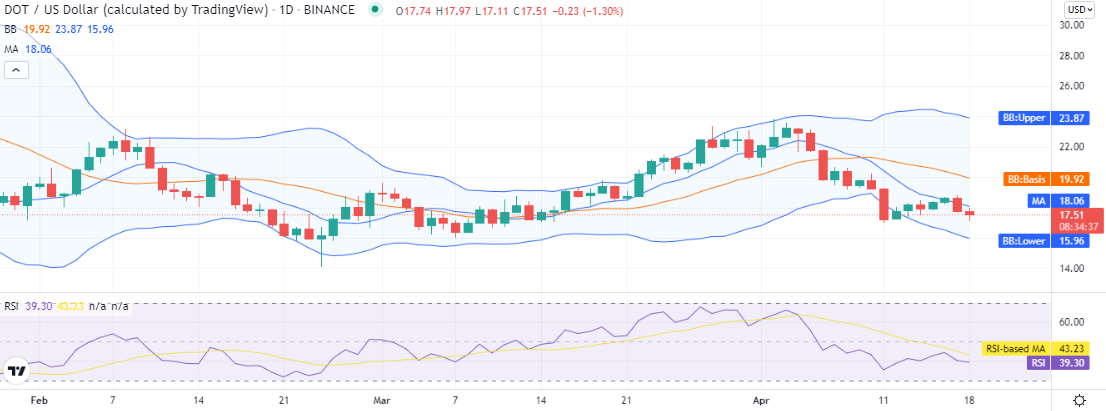
DOT/USD 1-day price chart: DOT continues downside
The 1-day price chart for Polkadot price analysis shows the price function is headed downwards for today, again following yesterday’s bearish lead. Bulls were in a strong position Previously as the trend line was going up until 16th April, but the trend changed yesterday, and bears got command.
The trend is the same for today as well, and the price has decreased up to $17.5 at the time of writing, and the crypto pair reports a loss of 5.68 percent over the last 24 hours and around 1.65 percent loss over the past week as the trend was bullish at the start of the week. The trading volume has increased by 56 percent today, providing a market dominance of 0.95 percent.

The Bollinger bands suggest high volatility for DOT as they show divergence, with the upper limit at the $23.8 mark representing resistance and the lower limit at the $15.9 mark, which represents the support level for DOT/USD. The relative strength index (RSI) is trading at a slight downwards curve as the bulls have also provided resistance to the bearish price action as the indicator shows a reading of 39 in the lower half of the neutral zone.
Polkadot price analysis: Recent developments and further technical indications
The 4-hour price chart for Polkadot price analysis shows the coin, after breaking out upwards at the start of the day, corrected strongly under bearish pressure for the next four hours late at night. However, bulls took the lead and defined the price action for the next eight hours continuously, but they were unable to make a breakthrough, and bears seemed to be making a comeback again in the coming hours.

The volatility is quite low on the 4-hour chart as the lower limit of the Bollinger bands is present at the $17.39 and the upper limit of the Bollinger bands is present at the $18.9 mark, providing the price movement to take place in a narrow range of just more then one dollar to fluctuate around. The RSI shows an upwards curve here as the price is still increasing with the ongoing slow buying activity. The indicator is trading at index 38 in the lower half of the neutral zone, as it has at least traveled relatively high from the underbought zone.
Polkadot price analysis conclusion
The Polkadot price analysis suggests the coin price action is dominated by the bearish side. The bullish help that appeared during the day and is still trying to elevate the price level lacks the momentum to outplay bears, so we expect the downtrend to return in the coming hours, as the broader crypto market is bearish today.
Disclaimer. The information provided is not trading advice. Cryptopolitan.com holds no liability for any investments made based on the information provided on this page. We strongly recommend independent research and/or consultation with a qualified professional before making any investment decisions.
- 39
- 7
- 9
- Action
- activity
- advice
- analysis
- April
- around
- bearish
- Bears
- Bullish
- Bulls
- Buying
- Coin
- coming
- continues
- crypto
- Crypto Market
- curve
- day
- developments
- Dollar
- efforts
- ELEVATE
- expect
- faced
- following
- function
- further
- going
- help
- here
- High
- holds
- HTTPS
- increased
- increasing
- index
- information
- investment
- Investments
- IT
- lead
- Level
- liability
- Line
- made
- Making
- mark
- Market
- Momentum
- more
- movement
- Outplay
- Point
- Polkadot
- position
- present
- pressure
- price
- Price Analysis
- professional
- providing
- qualified
- range
- Reading
- recommend
- Reports
- represents
- research
- Sellers
- So
- start
- strong
- support
- support level
- Technical
- time
- today
- Trading
- Volatility
- volume
- week
- writing


